Inflation
Expectations and the Final Mile of Disinflation

In the aftermath of the COVID-19 pandemic, the U.S. economy experienced a swift recovery accompanied by a sharp rise in inflation. Inflation has been gradually declining since 2022 without a notable slowdown in the labor market. Nonetheless, inflation remains above the Federal Reserve’s 2 percent target and the path of the so-called final mile remains uncertain, as emphasized by Chair Powell during his press conference in January. In this post, we examine the unemployment-inflation trade-off over the past few years through the lens of a New Keynesian Phillips curve, based on our recent paper. We also provide model-based forecasts for 2024 and 2025 under various labor market scenarios.
Our Model
In our framework (based on earlier work), inflation is driven by transient supply factors, inflation expectations, and labor market conditions. While there are alternative ways to measure labor market conditions, we use the unemployment gap as the building block for characterizing labor market conditions. The unemployment gap is defined as:
where ![]() is the realized unemployment rate and
is the realized unemployment rate and ![]() is the natural rate of unemployment defined in Milton Friedman’s 1968 Presidential Address to the American Economic Association. The natural rate of unemployment is a time-varying unobserved variable that reflects, among other things, secular trends (the aging of the baby boomers, for example), changes in the mismatch between vacant jobs and available workers, or shifts in willingness to work (perhaps due to changing attitudes about work-life balance).
is the natural rate of unemployment defined in Milton Friedman’s 1968 Presidential Address to the American Economic Association. The natural rate of unemployment is a time-varying unobserved variable that reflects, among other things, secular trends (the aging of the baby boomers, for example), changes in the mismatch between vacant jobs and available workers, or shifts in willingness to work (perhaps due to changing attitudes about work-life balance).
The New Keynesian Phillips curve relates inflation to the current unemployment gap ( ) and to expectations about future unemployment gaps (
 and so on) and gives us a useful way of decomposing current inflation,
  , as:
, as:

where ![]() is the slope of the Phillips curve and
is the slope of the Phillips curve and  is the long-run trend in inflation. Note that both the current and expected future unemployment gaps affect inflation through
 ![]() , a defining feature of the New Keynesian Phillips curve. This equation tells us that inflation is comprised of a fundamental component (“underlying inflation”) and a component reflecting supply shocks (such as global supply-chain disruptions).
, a defining feature of the New Keynesian Phillips curve. This equation tells us that inflation is comprised of a fundamental component (“underlying inflation”) and a component reflecting supply shocks (such as global supply-chain disruptions).
Because the natural rate of unemployment is not observed, we have to estimate it. In our paper, we use a wealth of labor market and inflation data to infer the evolution of ![]() and of economic agents’ expectations about the future path of the unemployment gap. We find a notable increase in
and of economic agents’ expectations about the future path of the unemployment gap. We find a notable increase in ![]() from around 5 percent before the pandemic to 6.6 percent at the end of 2023. We relate this rise to a declining willingness to work, a record-high quits rate (often referred to as the Great Resignation), rising reservation wages, and difficulties in filling vacant jobs, all of which have only recently started to moderate.
from around 5 percent before the pandemic to 6.6 percent at the end of 2023. We relate this rise to a declining willingness to work, a record-high quits rate (often referred to as the Great Resignation), rising reservation wages, and difficulties in filling vacant jobs, all of which have only recently started to moderate.
Analyzing Recent Disinflation
This high level of the natural rate relative to the much lower unemployment rate (which has remained below 4 percent since the end of 2021) would have suggested upward inflationary pressures.
So why has inflation been on a declining trend since 2022 amid such a tight labor market? There are two reasons: First, global supply chain disruptions, which had put upward pressure on inflation starting in 2021, have abated; second, what matters for inflation is less about the current unemployment gap and more about the expected path of future gaps going forward.
To confront the data with the model, we can go back to the second quarter of 2022 (approximately when inflation peaked) and see what the model anticipated. Importantly, when we perform this exercise we don’t give the model any information beyond what was available at that time.
The Model’s Unemployment Forecast Aligns with Professional Forecasts
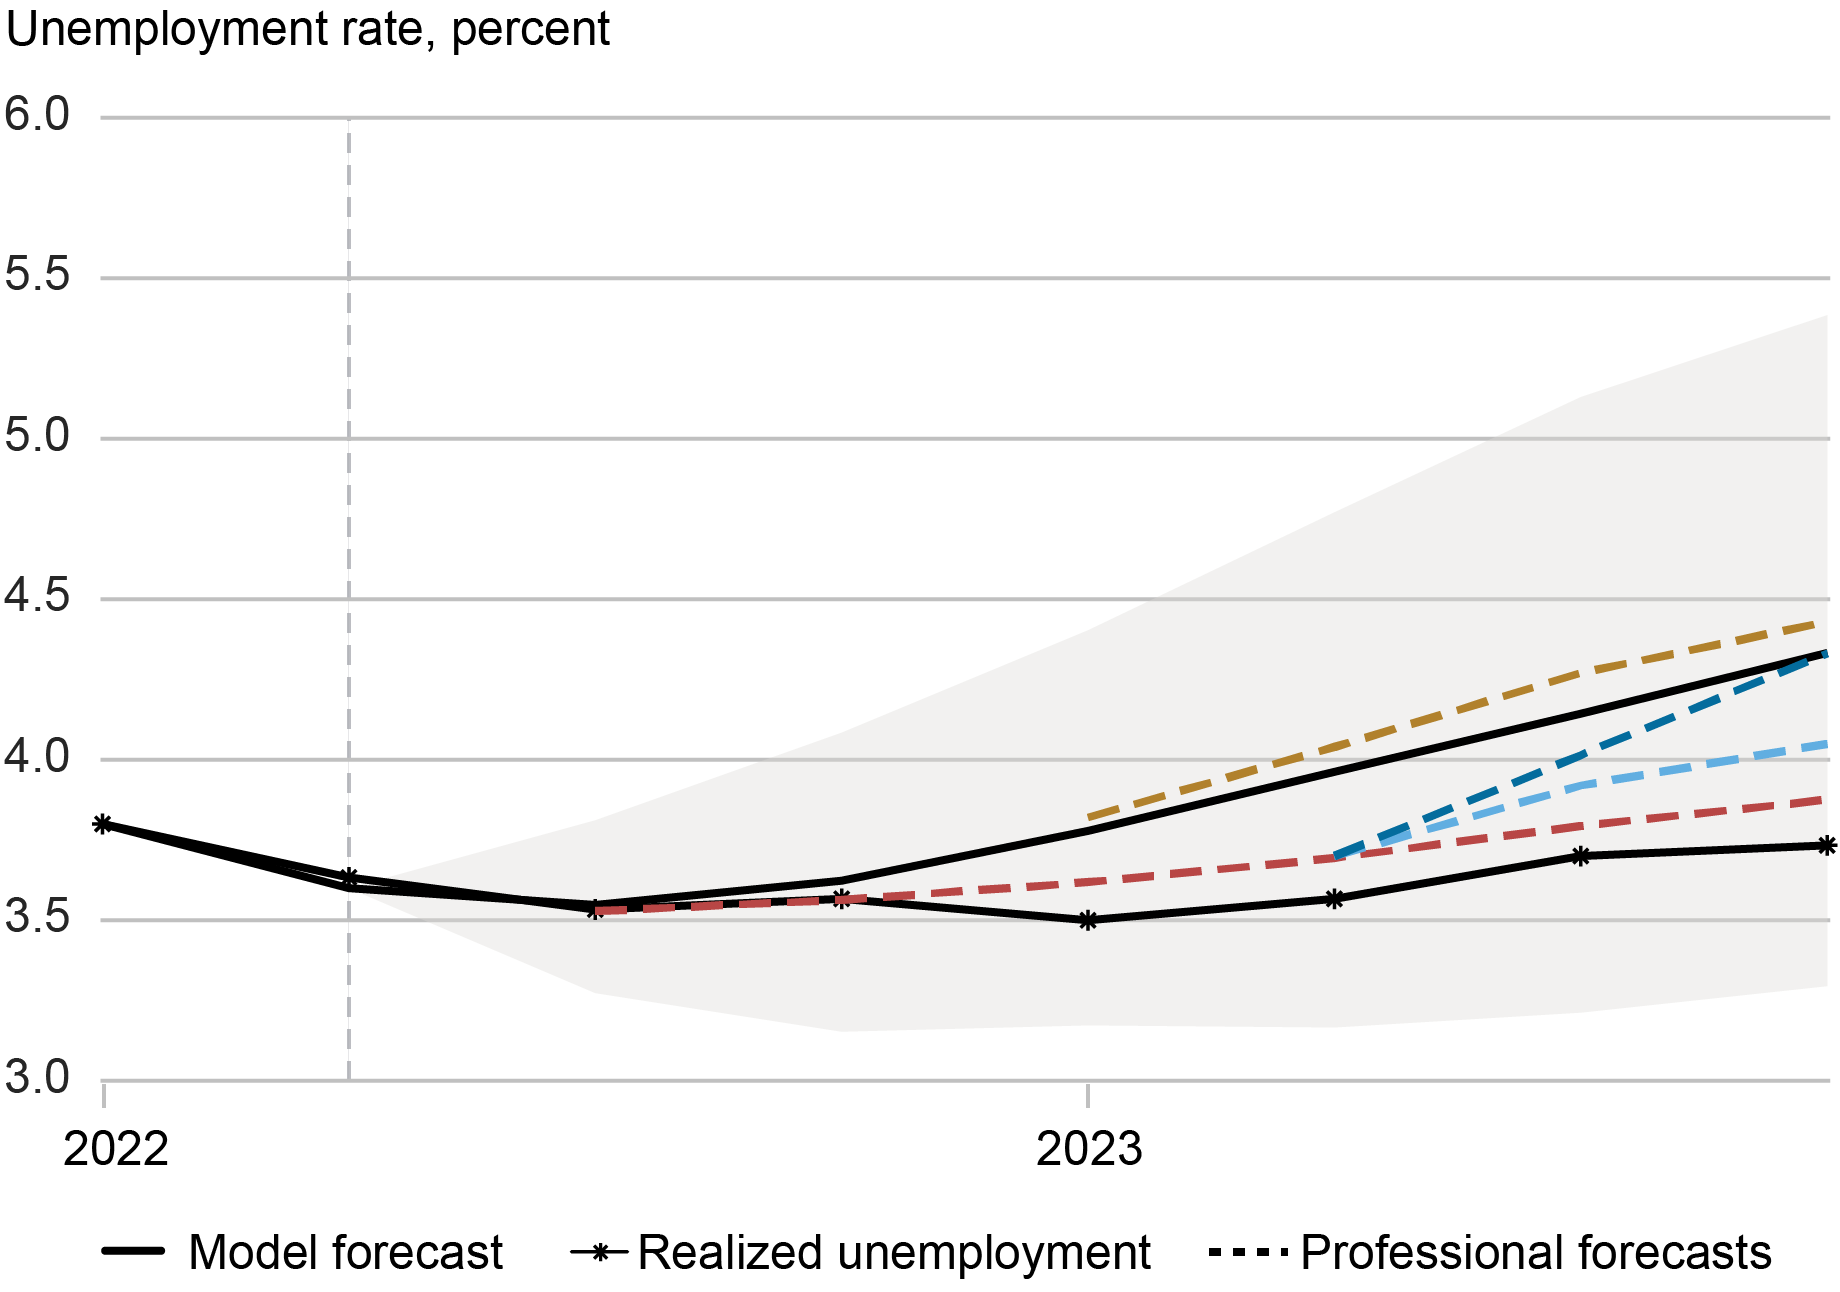 Sources: Authors’ calculations; Bureau of Labor Statistics; Federal Reserve Bank of Philadelphia; Blue Chip Economic Indicators.
Notes: This chart shows the model forecast path for the unemployment rate (black line) as of 2022:Q2 (delineated by dashed vertical line), along with the realized unemployment rate (line with asterisks). Dashed lines denote forecast paths from the Survey of Professional Forecasters and the Blue Chip Economic Indicators Survey at different times. Grey shaded regions denote 68 percent posterior coverage intervals.
The chart above shows the unemployment rate forecast generated by our model as of the second quarter of 2022, along with the realized unemployment rate. Clearly, the model forecast was higher than the actual unemployment rate over this period—but that projection aligns with the expectations of professional forecasters at the time, also plotted above. This expectation of a gradual increase in the unemployment rate then drives the gradual decline in underlying inflation, which is shown in the chart below.
Realized Inflation Converged to the Model Forecast for Underlying Inflation
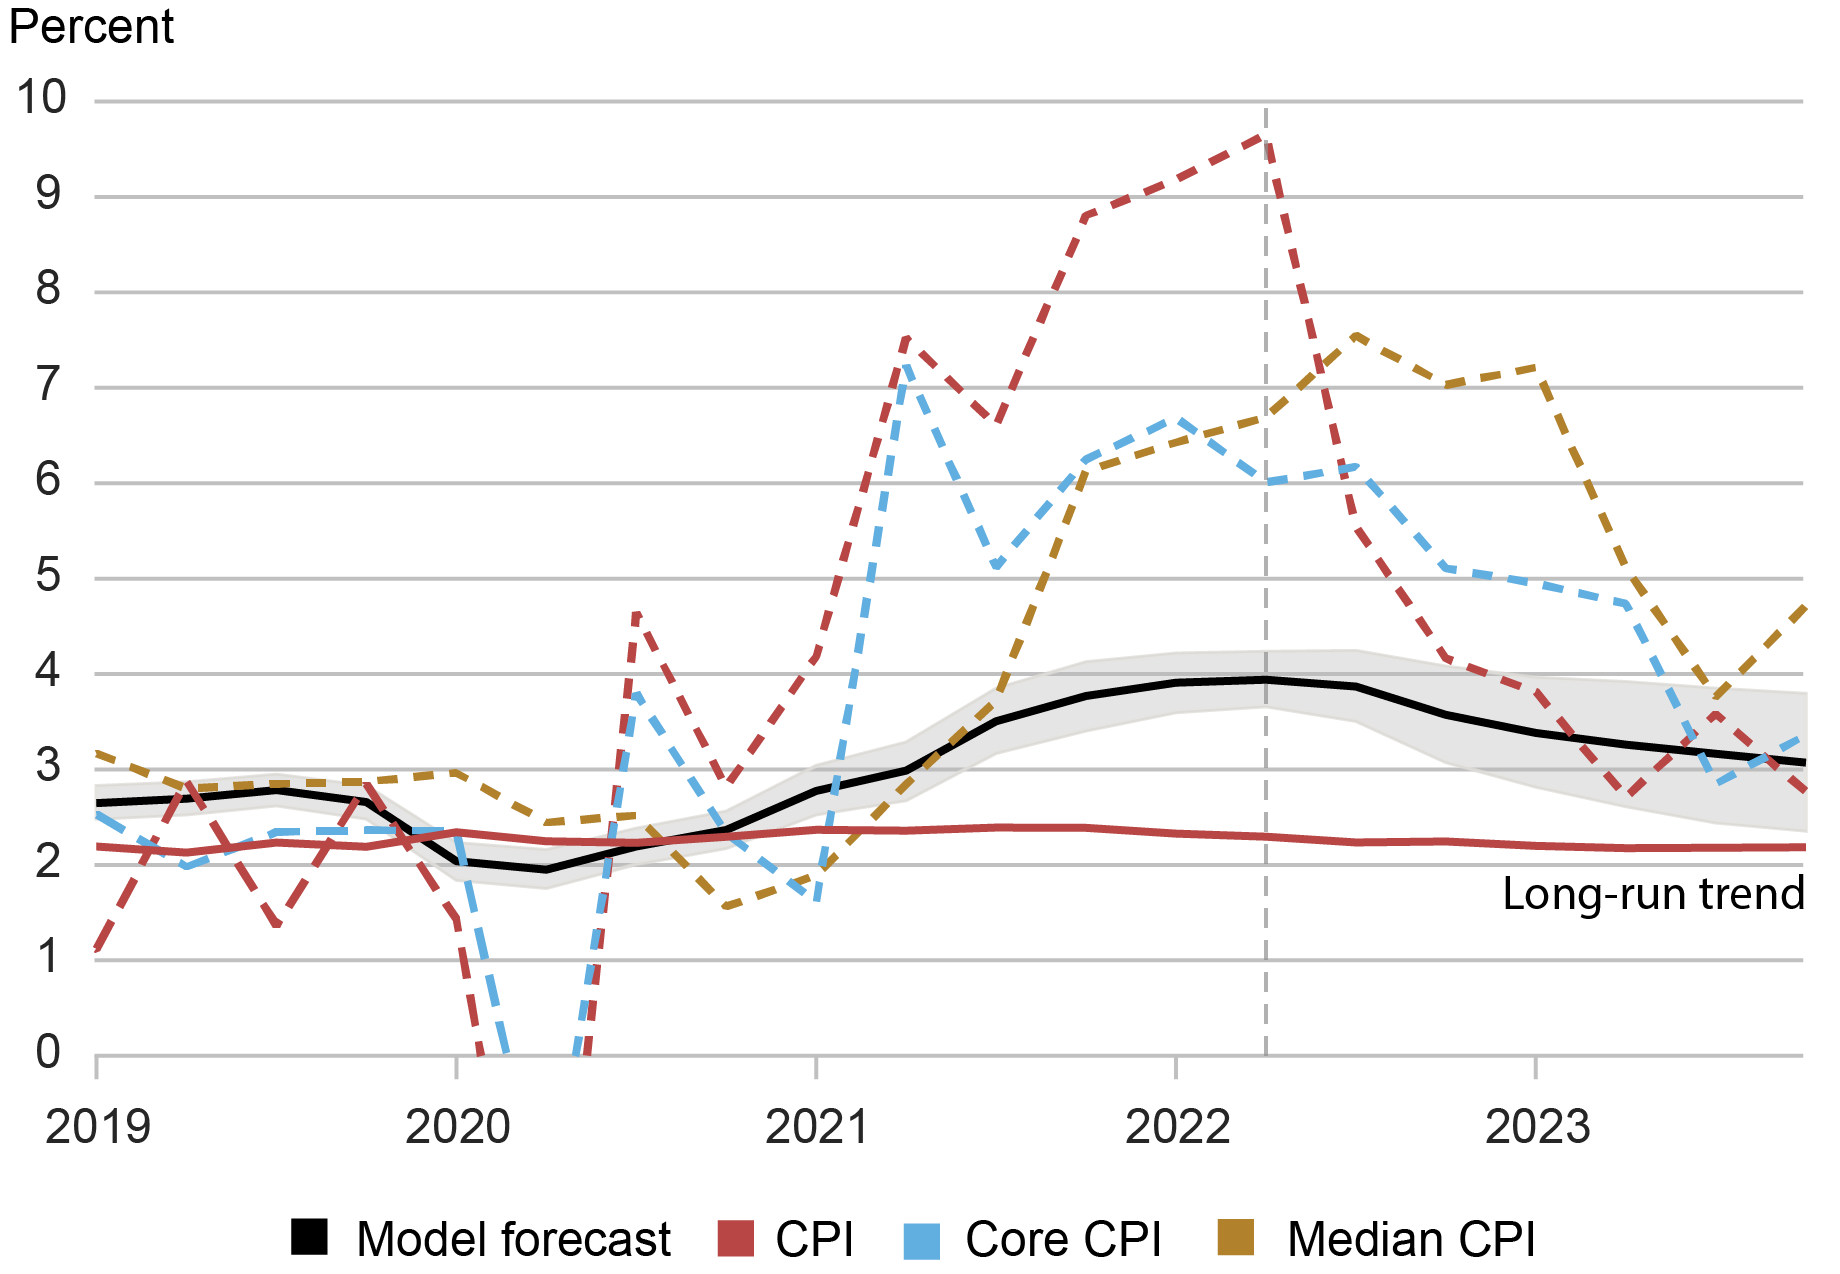 Sources: Authors’ calculations; Bureau of Labor Statistics; Federal Reserve Bank of Cleveland.
Notes: This chart shows the model forecast path for underlying inflation (black line) as of 2022:Q2 (delineated by the vertical line). Dashed lines denote realized CPI inflation, core CPI inflation, and median CPI inflation from the Federal Reserve Bank of Cleveland. Grey shaded regions denote 68 percent posterior coverage intervals.
We can see that all of the realized inflation measures converged to almost the exact same place: the model forecast for underlying inflation. This tells us two things. First, it shows that underlying inflation is an important object for better understanding the medium-term behavior of inflation. Second, it gives us confidence in our model’s forecasting ability.
The disinflation that occurred from 2022 to 2023 thus shows how the behavior of inflation depends critically on expectations of changes in labor market conditions and, therefore, on expectations of macroeconomic policy.
Current Inflation Outlook According to Our Model
So what is the model’s current forecast for 2024 and beyond? In the chart below, we show the forecast for underlying inflation using information up to the fourth quarter of 2023. First, since supply shocks have dissipated, achieving the Fed’s 2 percent inflation target requires underlying inflation, itself, to reach that target. The model predicts that further disinflation—the final mile—is likely to be gradual. It bears emphasizing that these are our model-based forecasts and not official projections.
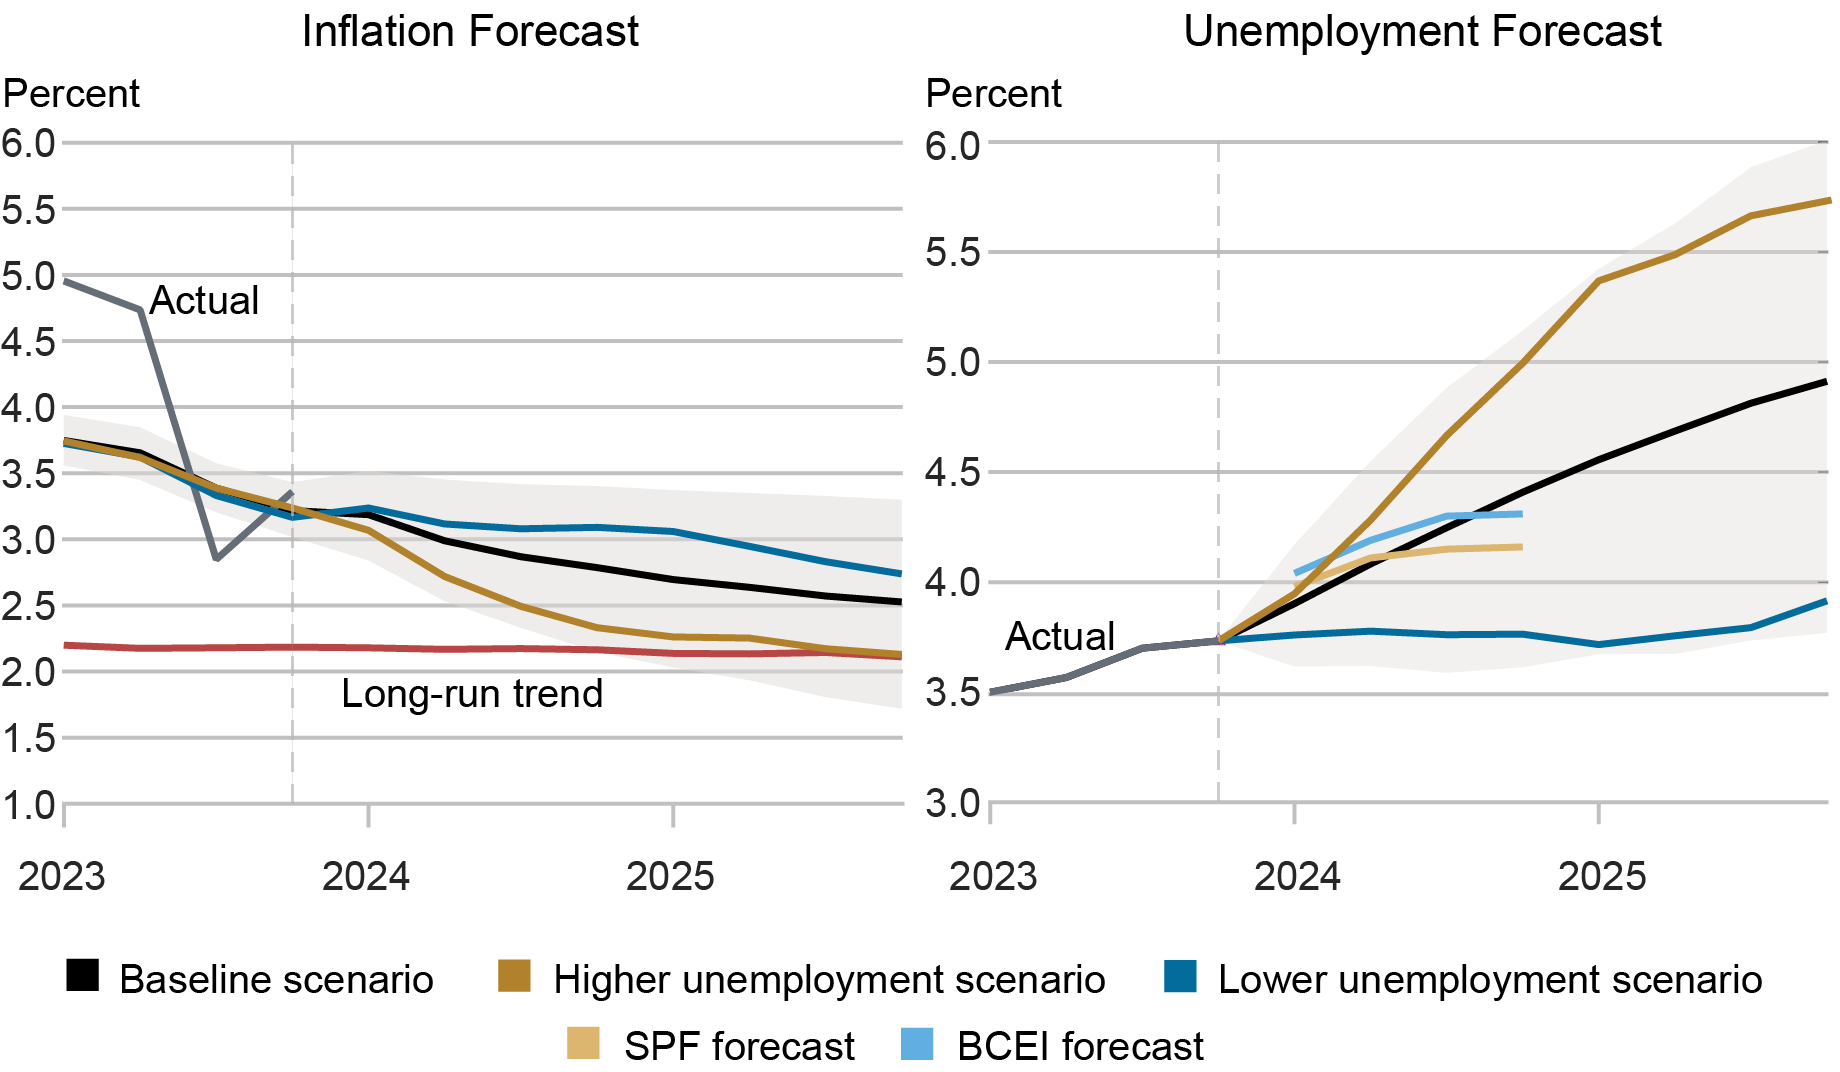
What affects the speed of disinflation? In the chart below, the left panel presents three forecast scenarios for inflation based on possible future paths of the unemployment rate, shown in the right panel. When the unemployment rate rises faster than the baseline forecast, then underlying inflation reaches its long-run trend (red line) by the end of 2025 (gold line). However, when the unemployment rate moves sideways, then the pace of disinflation is slower (blue line).
Labor Market Conditions Define the Disinflation Path
 Sources: Authors’ calculations; Bureau of Labor Statistics; Federal Reserve Bank of Philadelphia; Blue Chip Economic Indicators.
Notes: This chart shows the model forecast path for underlying inflation (black line, left panel) and the unemployment rate (black line, right panel) as of 2023:Q4 (delineated by vertical line). The gold line shows the inflation forecast based on a steeper increase in the forecasted unemployment rate; the dark blue line shows the inflation forecast based on a shallower increase in the forecasted unemployment rate. The solid red line in the left panel denotes the long-run trend in inflation. Grey shaded regions denote 68 percent posterior coverage intervals. The pair of short lines in the right panel show unemployment rate forecasts from the Survey of Professional Forecasters (SPF) and the Blue Chip Economic Indicators (BCEI) Survey as of end-2023.
For comparison, the right panel also shows the expected path of the unemployment rate from the Survey of Professional Forecasters (SPF) and the Blue Chip Economic Indicators (BCEI) Survey as of the end of last year. These expected paths are broadly consistent with the model’s unemployment rate forecasts. However, as we learned from the 2022-23 period, the disinflation process will depend critically on expected macroeconomic conditions. Changes in these expectations will then have direct implications for the path for inflation.

Richard K. Crump is a financial research advisor in Macrofinance Studies in the Federal Reserve Bank of New York’s Research and Statistics Group.
Stefano Eusepi is an associate professor of economics at the University of Texas at Austin.
Ayşegül Şahin is the Richard J. Gonzalez Regents Chair in Economics at the University of Texas at Austin and an adviser to the Federal Reserve Bank of Dallas.
How to cite this post:
Richard K. Crump, Stefano Eusepi, and Ayşegül Şahin, “Expectations and the Final Mile of Disinflation,” Federal Reserve Bank of New York Liberty Street Economics, March 5, 2024, https://libertystreeteconomics.newyorkfed.org/2024/03/expectations-and-t....

The Unemployment-Inflation Trade-off Revisited: The Phillips Curve in COVID Times

How Large Are Inflation Revisions? The Difficulty of Monitoring Prices in Real Time

How Do Firms Adjust Prices in a High Inflation Environment?
Disclaimer
The views expressed in this post are those of the author(s) and do not necessarily reflect the position of the Federal Reserve Bank of New York or the Federal Reserve System. Any errors or omissions are the responsibility of the author(s).
Global Supply Chains and U.S. Import Price Inflation

Inflation around the world increased dramatically with the reopening of economies following COVID-19. After reaching a peak of 11 percent in the second quarter of 2021, world trade prices dropped by more than five percentage points by the middle of 2023. U.S. import prices followed a similar pattern, albeit with a lower peak and a deeper trough. In a new study, we investigate what drove these price movements by using information on the prices charged for products shipped from fifty-two exporters to fifty-two importers, comprising more than twenty-five million trade flows. We uncover several patterns in the data: (i) From 2021:Q1 to 2022:Q2, almost all of the growth in U.S. import prices can be attributed to global factors, that is, trends present in most countries; (ii) at the end of 2022, U.S. import price inflation started to be driven by U.S. demand factors; (iii) in 2023, foreign suppliers to the U.S. market caught up with demand and account for the decline in import price inflation, with a significant role played by China.
Methodology
We use bilateral trade data for all shipments of disaggregated products from an exporting country to an importing country for fifty-two countries, which make up more than 90 percent of U.S. imports. We divided the value of each HS10-country observation by the quantity to form the unit value, which is our measure of the price. We estimate the average change in log prices for each exporter and each importer for each product in each quarter, all relative to the global median price. We refer to the worldwide median as the “global common shock,” the exporter average price change less the median change as the “idiosyncratic supply shock,” and the importer average price change less the median one as the “idiosyncratic demand shock.” Our forthcoming publication in the American Economic Association (AEA) Papers and Proceedings provides more details of this methodology. Below, we summarize our findings, and for this post, we extend the sample period to include 2023.
U.S. Aggregate Import Prices
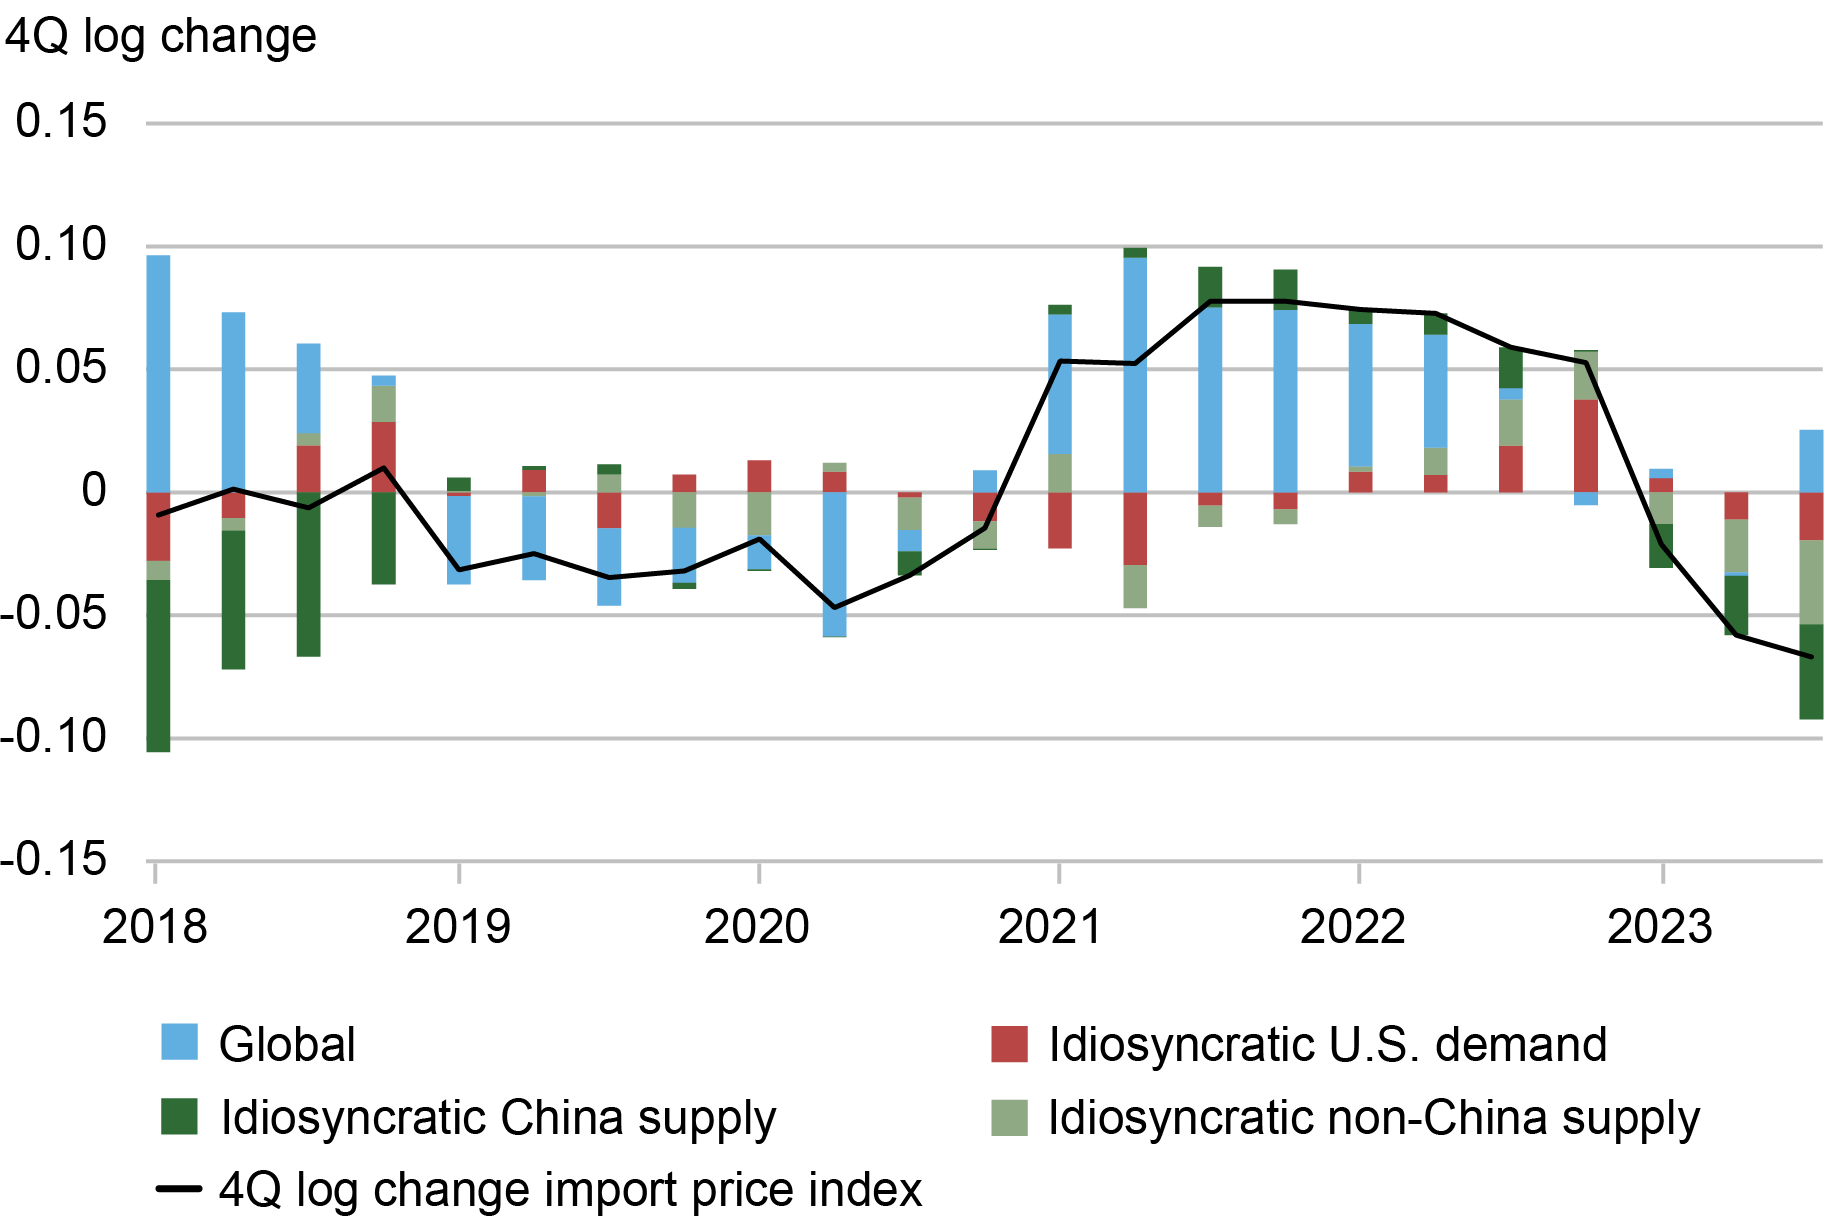
The chart below plots the decomposition of the changes in aggregate U.S. import prices and shows the sources of the rise and fall of aggregate import price inflation, corresponding to the black line. We also plot each of the three components (common, idiosyncratic U.S. demand, and idiosyncratic export supply price shocks), where we further split the export supply price shock into the element driven by China (dark green) and other exporters to the U.S. (light green). The sum of the colored bars equals the change in the aggregate import prices.
Global Factors Drive Growth in U.S. Import Prices after COVID-19 until Mid-2022
 Source: Authors’ calculations based on data from UN COMTRADE and GTAS.
Note: See Amiti, Itskhoki, Weinstein, “What Drives U.S. Import Price Inflation?” for details.
The chart shows that import price inflation was driven mainly by the global common shock (blue bars) until the second half of 2022. Import price inflation rose to 8 percent in the second half of 2021 and fell to -6 percent by the third quarter of 2023. The global common factor (blue bars) played a dominant role in the aftermath of COVID-19 when all countries struggled to re-open their economies. However, by the end of 2022, the global common factor stopped affecting import price inflation. Instead, idiosyncratic U.S. demand and later price reductions by the major exporters to the U.S. played the dominant role in price fluctuations.
In particular, idiosyncratically strong demand in the U.S. maintained high import inflation rates in the second half of 2022. However, this demand effect was short-lived and fell to close to zero at the start of 2023. These findings suggest that most import price inflation was common to all countries until the middle of 2022 and, therefore, cannot be explained by distinctive U.S. policies or policies peculiar to our trading partners. In other words, COVID-19 was a worldwide shock that affected import prices in all countries approximately equally.
As supply chain pressures have eased, import prices have fallen, and we see that idiosyncratic supply shocks have been responsible for the price declines in 2023. Perhaps in response to the high import prices that emerged after COVID-19, the U.S.’s leading suppliers ramped up production and dropped prices. The dark green bars indicate that much of the drop in import prices is due to China, whose exporters dropped prices by more than those in other countries. These patterns suggest that the U.S. import price inflation was not due to a poor choice of trading partners.
In the wake of COVID-19, import prices rose in the U.S. because they rose everywhere and not because of idiosyncratic U.S. demand or decisions made by our leading import suppliers. When U.S. import prices fell in 2023, it was mostly the product of large price drops by China and our other major import suppliers. Some of the decline in the U.S. import prices in 2023 may be due to the relative strength of the U.S. dollar, but we find little correlation between trade-weighted USD and import price inflation over the rest of the sample period.

Mary Amiti is the head of Labor and Product Market Studies in the Federal Reserve Bank of New York’s Research and Statistics Group.
Oleg Itskhoki is a professor of economics at the University of California, Los Angeles.
David E. Weinstein is the Carl S. Shoup Professor of the Japanese Economy at Columbia University.
How to cite this post:
Mary Amiti, Oleg Itskhoki, and David E. Weinstein, “Global Supply Chains and U.S. Import Price Inflation,” Federal Reserve Bank of New York Liberty Street Economics, March 4, 2024, https://libertystreeteconomics.newyorkfed.org/2024/03/global-supply-chai....

Pass‑Through of Wages and Import Prices Has Increased in the Post‑COVID Period

High Import Prices along the Global Supply Chain Feed Through to U.S. Domestic Prices
Disclaimer
The views expressed in this post are those of the author(s) and do not necessarily reflect the position of the Federal Reserve Bank of New York or the Federal Reserve System. Any errors or omissions are the responsibility of the author(s).
Austerity. The Past That Doesn’t Pass
[As usual lately, this is a slightly edited AI translation of a piece written for the Italian Daily Domani]
The European Commission recently revised downwards its forecasts for both growth and inflation, which continues to fall faster than expected. In contrast to the United States, there is no “soft landing” here. As argued by many, monetary tightening has not played a major role in bringing inflation under control (even as of today, price dynamics are mainly determined by energy and transportation costs). Instead, according to what the literature tells us on the subject, it is starting, 18 months after the beginning of the rate hike cycle, to bite on the cost of credit, therefore on consumption, investment and growth.
This slowdown in the economy is taking place in a different context from that of the pandemic. Back then, central bankers and finance ministers all agreed that business should be supported by any means, a fiscal “whatever it takes”. Today, the climate is very different, and public discourse is dominated by an obsession with reducing public debt, as evidenced by the recent positions taken by German Finance Minister Lindner and the disappointing reform of the Stability Pact. The risk for Europe of repeating the mistakes of the past, in particular the calamitous austerity season of 2010-2014, is therefore particularly high.
In this context, we can only look with concern at what is happening in France, where the government also announced a downward revision of the growth forecast for 2024, from 1.4% to 1%. At the same time, the Finance Minister Bruno Le Maire announced a cut in public spending of ten billion euros (about 0.4% of GDP), to maintain the previously announced deficit and debt targets. This choice is wicked for at least two reasons. The first is that it the government plans making the correction exclusively by cutting public expenditure, focusing in particular on “spending for the future”. €2 billion will be taken from the budget for the ecological transition, €1.1 billion for work and employment, €900 million for research and higher education, and so on. In short, it has been chosen, once again, not to increase taxes on the wealthier classes but to cut investment in future capital (tangible or intangible).
But regardless of the composition, the choice to pursue public finance objectives by reducing spending at a time when the economy slows, down goes against what economic theory teaches us; even more problematic, for a political class at the helm of a large economy, it goes against recent lessons from European history.
The ratio of public debt to GDP is usually taken an indicator (actually, a very imperfect one, but we can overlook this here) of the sustainability of public finances. When the denominator of the ration, GDP, falls or grows less than expected, it would seem at first glance logical to bring the ratio back to the desired value by reducing the debt that is in the numerator, i.e. by raising taxes or reducing government spending. But things are not so simple, because in fact the two variables, GDP and debt, are linked to each other. The reduction of government expenditure or the increase of taxes, and the ensuing reduction of the disposable income for households and businesses, will negatively affect aggregate demand for goods and services and therefore growth. Let’s leave aside here a rather outlandish theory, which nevertheless periodically re-emerges, according to which austerity could be “expansionary” if the reduction in public spending triggers the expectation of future reductions in the tax burden, thus pushing up private consumption and investment. The data do not support this fairy tale: guess what? Austerity turns out to be contractionary!
In short, a decline in the nominator, the debt, brings with it a decline in the denominator, GDP. Whether the ratio between the two decreases or increases, therefore, ends up depending on how much the former influences the latter, what economists call the multiplier. If austerity has a limited impact on growth, then debt reduction will be greater than GDP reduction and the ratio will shrink: albeit at the price of an economic slowdown, austerity can bring public finances back under control. The recovery plans imposed by the troika on the Eurozone countries in the early 2010s were based on this assumption and all international institutions projected a limited impact of austerity on growth. History has shown that this assumption was wrong and that the multiplier is very high, especially during a recession. A public mea culpa from the International Monetary Fund caused a sensation at the time (economists are not known for admitting mistakes!), explaining how a correct calculation gave multipliers up to four times higher than previously believed. In the name of discipline, fiscal policy in those years was pro-cyclical, holding back the economy when it should have pushed it forward. The many assistance packages conditioning the troika support to fiscal consolidation did not secure public finances; on the contrary, by plunging those countries into recession, they made them more fragile. Not only was austerity not expansive, but it was self-defeating. It is no coincidence that, in those years, speculative attacks against countries that adopted austerity multiplied and that, had it not been for the intervention of the ECB, with Draghi’s whatever it takes in 2012, Italy and Spain would have had to default and the euro would probably not have survived.
Since then, empirical work has multiplied, with very interesting results. For example, multipliers are higher for public investment (especially for green investment) and social expenditure has an important impact on long-term growth. And these are precisely the items of expenditure most cut by the French government in reaction to deteriorating economic conditions.
While President Roosevelt in 1937 prematurely sought to reduce the government deficit by plunging the American economy into recession, John Maynard Keynes famously stated that “the boom, not the recession, is the right time for austerity.” The eurozone crisis was a colossal and very painful (Greece has not yet recovered to 2008 GDP levels), a natural experiment that proved Keynes right.
Bruno Le Maire and the many standard-bearers of fiscal discipline can perhaps be forgiven for their ignorance of the academic literature on multipliers in good and bad times. Perhaps they can also be forgiven for their lack of knowledge of economic history and of the debates that inflamed the twentieth century. But the compulsion to repeat mistakes that only ten years ago triggered a financial crisis, and threatened to derail the single currency, is unforgivable even for a political class without culture and without memory.
Primer: Why Not Used Fixed Consumption Baskets In The CPI?
![]() This article is an unedited draft section from my inflation primer manuscript. This section is a re-write of content that I saw as having issues. This re-write has led me to be happier with the first chapter, which I had long seen as having problems. Given the importance of the free preview in online book sales, the first chapter has to be solid.
This article is an unedited draft section from my inflation primer manuscript. This section is a re-write of content that I saw as having issues. This re-write has led me to be happier with the first chapter, which I had long seen as having problems. Given the importance of the free preview in online book sales, the first chapter has to be solid.
One fundamental problem with the consumer price index is that it is the result of what most people would consider a complex calculation. This should not be surprising, since they are tasked with converting the price change of large number of items (80,000 items in the United States) into a single monthly index percentage change. People who are mad about the price of eggs going up generally just look at the price of eggs, they do not want to hear academic jibber-jabber about 80,000 items or (oh dear) a Laspeyres formula.
In this section, I am not going to attempt to explain the formulae used by the national statistical agencies. Anyone comfortable with reading those equations either know the answer already or would be sensible enough to go to the source agency rather than rely on me not mangling the equation during the editing process. Instead, I will explain the fundamental issues that we see in the simplest possible price index: one with two types of apples. A reader might immediately ask: why use two types of apples, and not apples and oranges (which I used in the first draft)? The explanation for that choice is given later, but the short answer involves not mixing up apples and oranges.
I want to warn readers that they should not spend time attempting to find logical flaws with my “index” calculations. I have come up with examples that I believe give a good feel for the underlying economic issues, but I can think of at least one way of “breaking” a suggested calculation by playing around with the numbers. Statistical agencies use more complex formulae than I use, and if you want to nitpick, you need to look at those formulae.
But before we get to simplified index calculations, we need to address why we need consumption weights in the first place? Why not just look at the price of a fixed basket of goods?
Fixed Basket of Goods
The most intuitive price index is one that corresponds to a fixed basket of goods. (Price indices also include services. But I will just write goods in this section since I do not want to have to write “fixed basket of goods and services.”) The idea is straightforward: if you buy the same goods at different times, how much does the price change? One whimsical version of this index is “The PNC Christmas Price Index.” This is an index that tabulates the cost of buying the items listed in the song “The Twelve Days of Christmas” (with a certain amount of imagination needed to determine prices for things like “10 lords-a-leaping” in the non-aristocratic United States). One might run into indices of this type in economic history, where researchers are attempting to summarise price trends in earlier eras when the CPI was not calculated.
To give an example that will be used in the rest of this section, imagine a price index for a subset of fresh fruit that just includes Cortland Apples and Empire apples. (These are two popular varieties of apples that are grown in Quebec, I have no idea whether readers elsewhere are familiar with them.) Although not too many people would be interested in such an index (other than apple lovers), this might be a sub-index of a larger index. We then assume that a household buys 30 apples of each type each month.
If the price for these applies conveniently start $1 at each, then the starting price for the total fruit basket is $60. We could strip the dollar sign out of the quoted number and say the price level is 60.
Let us then imagine that the price of Empire apples doubles to $2, but the Cortland ones remain at $1. Then the cost of the basket is $90 ($60 for the 30 Empire, and still $30 for the 30 Cortland). This is a 50% increase, which makes sense. Previously, there was a 50/50 weighting between Empire and Cortland, and so the overall inflation rate is a 50/50 weighting of the two percentage changes (100% and 0%).
Mad About Weightings
If you wade through complaints about rising prices not being reflected by the CPI, most of what you see are effectively complaints about weightings. People mad about price increases just want to talk about those price increases, and do not want to discuss other goods and services whose prices did not rise. In the previous example where Empire prices doubles but Cortland were unchanged, one would be ensured that there will be hundreds of angry people on the internet discussing Empire apple prices, but not Cortland. Even though the price index rose by 50%, that is not good enough because that does not match the 100% Empire price rise.
Although one might feel sad for fans of Empire apples, we need to accept that macroeconomics is the study of overall behaviour. Although the fixed basket of Cortland and Empire apples is imperfect (for reasons to be discussed), it at least is supposed to reflect an economic concern of households: how much am I spending on apples?
As such, we need to have some means of weighting the different percentage price changes into an average price change. When we look at how price indices are used, we need to have the weighting set so that they reflect the overall consumption of households.
Why Not a “Fixed Basket?”
We can then return to the question of having a “fixed basket”: always have the same number of items purchased each month? If we buy the same things every month, why not just add up their cost (like in my example)?
The immediate response to that question is that my example “index” is misleading, as it consists of generic fresh fruit that appear somewhat timeless from the point of view of consumers who are not particularly concerned about the histories of apple varieties. If we jumped to things linked to technology, problems with fixed consumption baskets are obvious. For example, renting VHS video cassettes was an extremely common expenditure item in the 1980s. At the time of writing, it is extremely hard to find stores that rent even the successor technology to VHS cassettes – Digital Video Discs (DVDs). Conversely, cellular data plans are a feature of most families’ budgets, and such plans did not exist in the 1980s. Any attempt to create a fixed basket of consumption goods is eventually going to look laughable in modern industrial capitalist societies.
One might say that this is true for technology goods but is not true for non-processed foods. Why not have a fixed basket for those items? (One crank made exactly that argument on social media just before I wrote this section.) Even if we want to skate over awkward questions like how food with “organic” designations fit in with food when those designations did not exist, consumption weights change (admittedly slowly). North America consumption of quinoa was negligible in the 1970s. Coffee selection is vastly improved in North America since the 1980s, and grocery coffee purchases are increasingly weighted towards coffee pods.
Although whole foods are a convenient category that seems comparable over time – Statistics Canada has a section breaking out the prices used for selected ones as part of its CPI release – they are an increasingly small weighting in consumer budgets in developed countries. You can find other “generic” goods and services – natural gas, gasoline (sort of, blends change), hair cuts – but they are in scattered categories. To be useful, we need to make periodic surveys of consumption to get weights that reflect what people are actually spending money on.
Weightings are Tricky (And Get Some People Mad)
If government statisticians tracked every single transaction in the economy, they would know exactly the current consumption spending weighting of consumers. The problem is that they do not have access to that information. It is time consuming (and expensive) to survey consumers to get detailed breakdowns of their consumption. (By contrast, getting price data is relatively easy – just send government employees into stores to see what prices are posted.) Consumption surveys are done at a lower frequency. The U.S. Bureau of Labor Statistics describes the weighting situation as:
The CPI measures the change in the cost of goods and services purchased by consumers from one period to the next. Household spending weights are used to average the changes in component goods and services into the All-items index. In the first 50 years of producing the CPI, the BLS updated the spending weights roughly every 10 to 15 years based on spending information collected in periodic household surveys. In the 1980s the Consumer Expenditure Surveys (CE) became continuous and the BLS began updating the CPI spending weights every two years, starting in 2002, when the CE sample was increased to support more frequent weight updates.
(Taken from the 2022 CPI Weight Update information: https://www.bls.gov/cpi/tables/relative-importance/weight-update-information-2022.htm.)
An update frequency of every two years might not sound too bad, but there is a fundamental problem: consumption patterns will shift based on price changes. For readers who are fans of free market capitalism, one of the selling points of the system is that households and firms change behaviour based on price signals. If the price of Empire apples doubles, you are supposed to say to yourself “Maybe I will replace my intake of relatively expensive Empire apples by Cortland apples.” If we had monthly surveys of consumption weights that updated in line with prices, we would know how much substitution happened. But we do not, and so economists need a methodology to make a guess how much substitution occurred.
Although most of us accept that we are stuck with making an educated guess for substitution, this is a topic gets some people mad. By an amazing coincidence, the people who are most mad about assuming that consumers substitute away from goods that jumped in price are pretty much the same people who insist that free market capitalism is great because of price signals. (I will be dwelling on this point multiple times in this book, since it is shows up in a variety of complaints.)
I will now look at possible alternatives to what happens in response to the Empire apple jump.
Total Substitution
If we wanted to reduce the reported rate of inflation, we could assume that consumers substitute completely away from the relatively expensive apples. Instead of buying 30 Empire and 30 Cortland, they could just buy 60 Cortland apples. Since we assumed that Cortland prices are unchanged at $1, the total consumption is unchanged at $60. This is a 0% inflation rate (matching the inflation rate for the Cortland variety).
Of course, this outcome does not match the description of the fixed consumption basket – since the number of each item changed. Instead, we have a situation like the commonly used price indices (like the CPI): we are tracking the cost of a category of goods (apples within fresh fruits) over time. Since we no longer are buying a fixed basket of goods, we really should not put a dollar value on the index. Instead, we are looking at the percentage change in the price of buying two varieties of apples over time.
Since we are not using a fixed menu of purchase amounts, we are always working with relative prices. To calculate the percentage change on the overall basket, add up the percentage changes of each item multiplied by their assumed weight in the monthly purchase basket. In the case of total substitution, we have a 0% weight on the 100% change in Empire prices plus a 100% weight on the 0% change in Cortland prices. In the fixed basket example, there is a 50% weight on the two price changes, giving the 50% overall inflation rate.
However, assuming consumers always stop purchasing goods whose prices rose the most would be as silly as always putting a 100% weight on the fastest-rising prices. (In fact, there are some logical problems with such a situation. What happens if Empire apples were unchanged the next month, while Cortland apple prices doubled?) We need some magic way to split the difference.
Mysterious Model Weight
We then let some economists loose to come up with a model that gives us an updated consumption weight that is a function of relative price changes. (If every single item in the sub-index has the same percentage change, the weighting does not matter.) If you want to go through the literature, there will be a lot of jargon discussing the models. My expectation is that the reader is not in charge of developing new price indices, and so I see no need to delve into this jargon.
Since I am lazy, I will assume that the model output conveniently hits the midway point between the two previously discussed cases. This is purely a literary assumption – actual models used in practice will have different weighting shifts based on the data.
If we assume that consumers split the difference and buy 45 cheap Cortland apples and 15 expensive Empire ones (instead of 30/30), the total cost of the basket is now $75. This is 25% higher than the previous basket price of $60. This 25% inflation rate is determined by having a 75% weight on the Cortland price change, and a 25% weight on the Empire price change.
If we want to think in terms of the prices of baskets of goods, the inflation rate that is calculated is not the change in the price of the old basket of goods in the current period. Instead, it is the change in the price of the current basket of goods versus buying that new basket at the old prices.
This is not how people who get mad at inflation statistics want to think. They invariably present price changes based on buying the old basket of goods at current prices, rather than what being based on what it would have cost to buy the current basket at the old prices.
To the extent that price spikes represent shortages, we also have the problem that substitution must happen. If Empire apple prices spiked because there was a highly selective crop failure, there are less Empire apples to buy. The volume of Empire apple purchases must fall. That said, this is trickier to apply to globally traded goods. There might be a shortage of oil at the global level, leading to a price spike on oil markets, but a rich country might keep importing the same amount and keep consumption unchanged.
We only would know how much substitution there was if we had access to monthly consumption data (which we do not).
Let Us Mix Up Apples and Oranges!
We can then ask ourselves: if apple prices have a high relative price shift, why would consumers not get their fresh fruit fix by buying oranges? That is, we could assume that consumers will substitute spending based on relative price shifts within the wider fresh fruit category.
This is a possibility that creates a lot of complaints about CPI, based on people not paying attention to the actual calculations. The CPI calculations generally do not allow for substitution across item categories. To quote Greenlees and McClelland in “Addressing misconceptions about the Consumer Price Index”:
To begin, it must be stated unequivocally that the BLS does not assume that consumers substitute hamburger for steak. Neither the CPI-U, nor the CPI-W used for wage and benefit indexation, allows for substitution between steak and hamburger, which are in different CPI item categories. Instead, the BLS uses a formula that implicitly assumes a degree of substitution among the close substitutes within an item-area component of the index. As an example, consumers are assumed to respond to price variations among the different items found within the category “apples in Chicago.” Other examples are “ground beef in Chicago,” “beefsteaks in Chicago,” and “eggs in Boston.”
I used the non-intuitive “Empire versus Cortland apples” instead of “apples versus oranges” because the U.S. CPI calculation does not allow for substitutions across apples and oranges, only within “apples.” However, this is not going to hold for every price index, as they may allow for substitution effects within categories like fresh fruit.
At the higher level, one might ask whether people substitute across much different categories. If movies get more expensive, will they instead buy a video game? Although people always need to eat, they can do things like eat at home instead of at a restaurant.
To the extent that price indices do not allow substitution, they are going to overstate the true cost inflation experienced by households who react to price signals. This partly explains the massive disconnect between the mainstream economists that argue that the CPI overstates inflation versus the commentators who insist that CPI inflation rates understate inflation.
Non-Existent Goods
Another issue that pops up in index calculation is that we might have a price for a good or service in one month, but not in another. This could be the result of data gathering issues, outright shortages, a product coming into existence – or being pulled from the market.
Since we only have a price for the good or service for one month, we cannot give a percentage change in the price. One would need to dig into the methodology handbook to see how each statistical agency deals with this.
However, there is an interesting philosophical issue created by new product launches. In an environment of rising wages, it is easy to see how new product offerings might be “luxury” versions of existing ones.
One example that comes to mind is the evolution of take-away “coffee drinks” in North America from mainstream venues. Back in the Good Old Days (i.e., when I was a kid), North Americans mainly just bought plain coffees from restaurants/doughnut shops. By the 1980s, you had an infiltration of cappuccino and espresso and so forth in mainstream restaurants. Later on, we saw the rise of “iced coffee drinks.” Each of these evolutions had new beverages coming out at higher price points relative to the existing drinks.
Even though the prices of standard coffees might not have risen by much, switching to the new drinks meant that consumers were paying more money for the same amount of caffeine buzz. This allowed restaurants to grow their nominal sales, even though the stores might have had the same overall volume of customers.
This leads to one of my personal inflation theories. When we look at the late 1990s, the economy was buoyant, but the bears were mystified: where is the inflation? My reading of the situation was that companies were able to absorb increased nominal demand by pushing out luxury brands. This worked until the pandemic, where product innovations were not enough to absorb the nominal demand.
Concluding Remarks
It would be very easy to drown in jargon and mathematical notation when looking at conventional descriptions of price indices. Most of the internal debates among economists refer to complex assumed behaviour. But it is possible to see how price index calculations run into rather awkward questions by just looking at what happens with a basic example.
References
-
Detailed discussion of price index construction is best found at the methodology guides of national statistical agencies. Example references are listed in Section 1.2.
-
The PNC Christmas Price Index has been calculated by the PNC Financial Services group for over 40 years. It has a web page found at: https://www.pnc.com/en/about-pnc/topics/pnc-christmas-price-index.html
-
Greenlees, John S., and Robert B. McClelland. “Addressing misconceptions about the consumer price index.” Monthly Labor Review 131 (2008)
Email subscription: Go to https://bondeconomics.substack.com/
(c) Brian Romanchuk 2024
Australian inflation rate remains on a downward trajectory
Today (February 28, 2024), the Australian Bureau of Statistics (ABS) released the latest – Monthly Consumer Price Index Indicator – for January 2024, which showed that the inflation rate steadied at 3.4 per cent but remains in a downward trajectory in Australia as it is elsewhere in the world. Today’s figures are the closest we…
Businesses See Inflationary Pressures Moderating

Shortly after the recovery from the pandemic recession began, the U.S. economy entered a period of high inflation as surging demand, severe supply disruptions, and worker shortages combined to create large imbalances and inflationary pressures in the economy. More recently, however, inflationary pressures have been moderating. Indeed, the inflation rate as measured by the consumer price index (CPI) has come down from its recent peak of 9.1 percent in the summer of 2022 to 3.1 percent at the start of 2024. Have inflationary pressures also moderated for local businesses in the New York–Northern New Jersey region? The New York Fed’s February business surveys asked firms about increases in their costs and prices. Results indicate that the pace of increase in costs, wages, and prices have all slowed considerably over the past year. Moreover, firms in the region expect cost and price increases, as well as the overall inflation rate, to moderate further in the year ahead.
Cost, Wage, and Price Increases Have All Slowed Considerably
While inflation remains higher than ideal, much progress has been made. CPI inflation has fallen 6 percentage points since June 2022, and inflation as measured by the producer price index has come down more than ten percentage points from its peak. Supplementary questions in the February Empire State Manufacturing Survey and Business Leaders Survey focused on recent and expected changes in firms’ costs, wages, and selling prices. Results reveal that regional firms are seeing the pace of increase in their costs and prices slowing, consistent with patterns in overall inflation.
Indeed, as the chart below shows, while firms reported an average cost increase of 11 to 13 percent for 2022, such increases fell to 5 to 6 percent over the past year. Wage increases in 2022 were about 5.5 percent for service firms and 6.4 percent for manufacturers, and slowed to 4.3 percent and 5.3 percent, respectively, over the past twelve months. A similar pattern was observed for selling price increases, which fell from an average of 7.3 percent among service firms and 9.5 percent among manufacturers in 2022 to an average of 5.3 percent and 3.2 percent, respectively, this past year. Firms expect all three measures to moderate further over the next twelve months: for both types of firms, cost increases are expected to slow to around 3.6 percent, wage increases are expected to slow to 3.8 percent, and selling price increases expected to fall to around 3 percent.
Firms See Inflationary Pressures Moderating
Service Firms
Percent
{"axis":{"rotated":false,"x":{"show":true,"type":"category","localtime":true,"tick":{"centered":false,"culling":false,"fit":true,"outer":true,"multiline":false,"multilineMax":0},"label":{"text":"","position":"outer-center"},"categories":["Costs","Wages","Prices"]},"y":{"show":true,"inner":false,"type":"linear","inverted":false,"tick":{"centered":false,"culling":false},"padding":{"top":3,"bottom":0},"primary":"","secondary":"","label":{"text":"","position":"outer-middle"},"min":0,"max":13},"y2":{"show":false,"inner":false,"type":"linear","inverted":false,"padding":{"top":3},"label":{"text":"","position":"outer-middle"}}},"chartLabel":"Service Firms
Percent","padding":{"auto":true},"color":{"pattern":["#046C9D","#D0993C","#9FA1A8","#656D76","#8FC3EA","#0D96D4","#B1812C"]},"interaction":{"enabled":true},"point":{"show":false},"data":{"groups":[],"labels":false,"type":"bar","order":"desc","selection":{"enabled":false,"grouped":true,"multiple":true,"draggable":true},"x":"","rows":[["Past 12 mos. (asked Dec 2022)","Past 12 mos. (asked Feb 2024)","Next 12 mos. (asked Feb 2024)"],["11","6.1","3.7"],["5.5","4.3","3.8"],["7.3","5.3","3.1"]]},"legend":{"show":true,"position":"bottom"},"tooltip":{"show":true,"grouped":true},"grid":{"x":{"show":false,"lines":[],"type":"indexed","stroke":""},"y":{"show":true,"lines":[],"type":"linear","stroke":""}},"regions":[],"zoom":false,"subchart":false,"download":true,"downloadText":"Download chart","downloadName":"chart","trend":{"show":false,"label":"Trend"}}
Manufacturing Firms
Percent
{"chartLabel":"Manufacturing Firms
Percent","padding":{"auto":true},"color":{"pattern":["#046C9D","#D0993C","#9FA1A8","#656D76","#8FC3EA","#0D96D4","#B1812C"]},"interaction":{"enabled":true},"point":{"show":false},"data":{"groups":[],"labels":false,"type":"bar","order":"desc","selection":{"enabled":false,"grouped":true,"multiple":true,"draggable":true},"x":"","rows":[["Past 12 mos. (asked Dec 2022)","Past 12 mos. (asked Feb 2024)","Next 12 mos. (asked Feb 2024)"],["13","4.7","3.6"],["6.4","5.3","3.8"],["9.5","3.2","2.8"]]},"legend":{"show":true,"position":"bottom"},"tooltip":{"show":true,"grouped":true},"axis":{"rotated":false,"x":{"show":true,"type":"category","localtime":true,"tick":{"centered":false,"culling":false,"fit":true,"outer":true,"multiline":false,"multilineMax":0},"label":{"text":"","position":"outer-center"},"categories":["Costs","Wages","Prices"]},"y":{"show":true,"inner":false,"type":"linear","inverted":false,"tick":{"centered":false,"culling":false},"padding":{"top":3,"bottom":0},"primary":"","secondary":"","label":{"text":"","position":"outer-middle"}},"y2":{"show":false,"inner":false,"type":"linear","inverted":false,"padding":{"top":3},"label":{"text":"","position":"outer-middle"}}},"grid":{"x":{"show":false,"lines":[],"type":"indexed","stroke":""},"y":{"show":true,"lines":[],"type":"linear","stroke":""}},"regions":[],"zoom":false,"subchart":false,"download":true,"downloadText":"Download chart","downloadName":"chart","trend":{"show":false,"label":"Trend"}}
Source: New York Fed February 2024 Supplemental Survey.
Inflation Expectations Are Also Moderating
Firms were also asked about their expectations for the overall inflation rate in the economy over the next year, a question which was also posed in surveys conducted in May and December of 2022. As the chart below shows, firms’ median year-ahead inflation expectations have come down noticeably. In May 2022, when inflationary pressures were near their peak, firms’ year-ahead inflation expectations, as measured by the CPI, were above 6 percent, though longer-run inflation expectations remained anchored. By the end of 2022, year-ahead inflation expectations had already come down slightly. In our most recent survey, after more than a year of moderating inflationary pressures, the overall inflation rate is now expected to be around 3 percent over the next year, the same as what consumers are expecting according to the New York Fed’s latest Survey of Consumer Expectations.
Firms’ Inflation Expectations Continue to Moderate
Percent
{"axis":{"rotated":false,"x":{"show":true,"type":"category","localtime":true,"tick":{"centered":false,"culling":false,"fit":true,"outer":true,"multiline":false,"multilineMax":0},"label":{"text":"","position":"outer-center"},"categories":["Service Firms","Manufacturing Firms"]},"y":{"show":true,"inner":false,"type":"linear","inverted":false,"tick":{"centered":false,"culling":false,"count":0,"values":["0","1","2","3","4","5","6","7"]},"padding":{"top":3,"bottom":0},"primary":"","secondary":"","label":{"text":"","position":"outer-middle"},"min":0,"max":7},"y2":{"show":false,"inner":false,"type":"linear","inverted":false,"padding":{"top":3},"label":{"text":"","position":"outer-middle"}}},"chartLabel":"Percent","padding":{"auto":true},"color":{"pattern":["#046C9D","#D0993C","#9FA1A8","#656D76","#8FC3EA","#0D96D4","#B1812C"]},"interaction":{"enabled":true},"point":{"show":false},"data":{"groups":[],"labels":false,"type":"bar","order":"desc","selection":{"enabled":false,"grouped":true,"multiple":true,"draggable":true},"x":"","rows":[["May 2022","Dec 2022","Feb 2024"],["6.1","5","3"],["6.5","6","3"]]},"legend":{"show":true,"position":"bottom"},"tooltip":{"show":true,"grouped":true},"grid":{"x":{"show":false,"lines":[],"type":"indexed","stroke":""},"y":{"show":true,"lines":[],"type":"linear","stroke":""}},"regions":[],"zoom":false,"subchart":false,"download":true,"downloadText":"Download chart","downloadName":"chart","trend":{"show":false,"label":"Trend"}}
Source: New York Fed February 2024 Supplemental Survey.
Note: Bar charts plot median year-ahead inflation expectations.
Final Thoughts
All in all, our February business surveys point to ongoing moderation in inflationary pressures. This is welcome news: though inflation remains elevated, much progress has been made over the past year and more progress is expected in the year ahead. Still, this is an issue we will be tracking closely. Visit our Regional Economy website to stay up to date on economic conditions in the region.

Jaison R. Abel is the head of Urban and Regional Studies in the Federal Reserve Bank of New York’s Research and Statistics Group.

Richard Deitz is an economic research advisor in Urban and Regional Studies in the Federal Reserve Bank of New York’s Research and Statistics Group.
How to cite this post:
Jaison R. Abel and Richard Deitz, “Businesses See Inflationary Pressures Moderating,” Federal Reserve Bank of New York Liberty Street Economics, February 21, 2024, https://libertystreeteconomics.newyorkfed.org/2024/02/businesses-see-inf....
Supplemental Survey Report (February 2024)

How Much Did Supply Constraints Boost U.S. Inflation?

Do Businesses in the Region Expect High Inflation to Persist?

Severe Supply Disruptions Are Impeding Business Activity in the Region
Disclaimer
The views expressed in this post are those of the author(s) and do not necessarily reflect the position of the Federal Reserve Bank of New York or the Federal Reserve System. Any errors or omissions are the responsibility of the author(s).
CPI-weighted wage growth
Josh Martin

The Monetary Policy Committee has recently looked at wage growth as an important indicator of inflation persistence. One way that wages matter for price inflation is as a cost for businesses, who may raise their prices in response to higher wages. For this channel, the wage measure needs to reflect the coverage and composition of the Consumer Prices Index (CPI). However, most wage measures do not. This blog explores a wage growth measure which is re-weighted to better match the CPI.
What’s the link between wages and inflation?
There are at least two reasons to care about wages for inflation. First, wages are a source of income, which earners can then spend. So higher wages increase demand, putting upward pressure on prices. Second, wages are a cost to businesses. Higher wages increase business costs, who might raise their prices to maintain their profit margins.
In the first story, all labour income in the economy is relevant for inflation, since all workers earn and all workers can spend. A measure that reflects total labour income, including bonuses for instance, would be appropriate.
In the second story, only wages that produce items in the CPI basket matter for inflation. Higher wages in a firm which only produces exports are not relevant for CPI prices, since exports are not in the CPI. By contrast, wages in a firm which produces something for household consumption in the UK, like restaurant meals, are very relevant for CPI.
How to match wage data to the CPI
Most wage data, including the Average Weekly Earnings (AWE) published by the Office for National Statistics (ONS), is weighted by employment. That means it gives more importance (weight) to industries with more employees. This allows the statistics to measure the average (mean) wage growth of all employees in the economy, and within each industry.
To construct a wage measure that best reflects the composition of the CPI basket, we need to adjust the weights. We want to give more weight to industries which produce consumption products, and less to industries that produce things not in the CPI basket, like exports, government output, and investment goods. Since we are thinking about wages as a cost, we also want to give more weight to industries that are more labour-intensive, since wages will be a more important cost for those industries.
What about industries that produce intermediate goods and services, like raw materials or business services? Firms that make consumer products buy those things, so the wage costs might get passed along the supply chain and be relevant for CPI too. For instance, if an accountancy firm raises wages, and a restaurant buys accountancy services, then the higher accountancy wages might lead to more expensive restaurant meals.
That’s possible, but requires several steps – the accountancy raises wages, they must also raise their prices, the restaurant then must also raise its prices because of the higher accountancy costs. In reality, either accountancy firm or restaurant might not raise prices and instead accept a temporarily lower profit margin given higher costs. There are also likely long lags between accountancy wages and restaurant prices. So, given uncertainty and time lags, I won’t factor in the wages of industries that produce intermediate inputs, only those producing products directly sold to consumers.
To figure out the right weights for our CPI-weighted wage measure, I use data from the supply and use tables (part of the National Accounts) to spread the CPI weights to industries. First, I match the CPI weights to the detailed ‘product’ categories in the supply and use tables, spreading them out where necessary. I have to account for the difference in coverage of the CPI and household consumption in the National Accounts – for instance, the CPI excludes gambling, but the National Accounts includes it.
Second, I split apart the CPI weight for goods into that which reflects the good itself, and that which reflects the retail and wholesale services required to get the good to consumers. For instance, when you buy a banana in the shop, you are paying partly for the banana itself, partly for the wholesaler who got it to the UK, and partly for the retailer who put it on the shelf. Consumers don’t buy retail services directly, only indirectly through other goods, so retail doesn’t have an obvious weight in the CPI – it needs to be separated from the weight of goods.
Third, I account for which CPI products are imported and which are produced domestically. Consumers may buy lots of bananas, but if most of those are imported, then the wages in the domestic banana industry aren’t so important after all. Finally, I account for the share of wages in total costs of the industry. In industries that are more labour intensive, wages will be a more important cost, and so more relevant for the price.
Putting all of that together and the summing up by industry gives us a new set of industry weights for our wage measure. This should, in theory, better reflect the importance of each industry’s wages in the CPI.
Does the re-weighting make much difference?
Using these new weights to aggregate the industry AWE regular pay growth rates published by ONS gives a CPI-weighted wage measure. Chart 1 shows the annual growth in this measure between 2001 and 2023. The chart also shows the annual growth in AWE whole economy and private sector regular pay for comparison.
Chart 1: Measures of annual regular pay growth, January 2001 to December 2023

Source: ONS and author’s calculations.
Notes: Rolling three-month averages of annual growth. Latest period October–December 2023.
Over the long run there is little difference between the CPI-weighted AWE and the headline measures published by ONS. That suggests that the measures we usually look at do a good job of capturing the key information for understanding wages as costs for businesses. The new measure is just a re-weighted version of the same data underlying the other measures, so it is perhaps unsurprising that they are similar.
In the past year or so, there is a little more difference between the measures, as shown in Chart 2, which is the same data as in Chart 1 but zoomed in on the period since January 2019. The CPI-weighted AWE grew slower than the headline AWE measures during most of 2023. But in the past few months, while the headline measures have slowed sharply, the CPI-weighted measure has been flatter. That’s because the industries driving the fall in the headline measures include professional services and construction. These industries don’t produce many consumer products, so get much lower weights in the CPI-weighted AWE measure.
Chart 2: Measures of annual regular pay growth, January 2019 to December 2023

Source: ONS and author’s calculations.
Notes: Rolling three-month averages of annual growth. Latest period October–December 2023.
Chart 3 shows the difference between the industry weights in 2023 in the AWE private sector measure and the CPI-weighted AWE measure described in this blog. Green bars show industries with more weight in the CPI-weighted measure, such as wholesale and accommodation and food services. Industries that get less weight (shown in red) include professional services, construction, and admin services – all business-facing industries. Some of these industries would likely get a greater weight if also factoring in industries producing intermediate inputs for use in making consumer products.
Chart 3: Difference in weight between CPI-weighted wages and AWE private sector, 2023

Source: ONS and author’s calculations.
Notes: Industries are defined by SIC 2007, consistent with AWE breakdowns. Positive (green) bars show more weight in the CPI-weighted measure than AWE private sector, and negative (red) bars show less weight. Units are percentage points; for instance, accommodation and food services is weighted 12.7 percentage points higher (22.1% versus 9.4%).
Other people have also thought about this issue. Former MPC-member Silvana Tenreyro, in a speech in 2020, constructed a CPI-weighted measure of unit labour costs (labour costs per unit of output). This used National Accounts data on labour costs and productivity, so is slightly different to the measure in this blog, but done for the same reasons. She found that CPI-weighted unit labour costs were growing slower than whole economy unit labour costs between 2017 and 2019, mostly due to differences in productivity growth.
In a recent series of blogs, the White House Council of Economic Advisors constructed a wage measure to match the composition of core non-housing services inflation. They have far more detailed industry wage data available than we do in the UK. They suggest that this measure is a slightly better predictor of future core non-housing services inflation than other private sector wage measures.
Summing up
Overall, it seems like re-weighting wage data to match the CPI is a good idea in theory, but doesn’t make very much difference in practice, at least not so far. That might be because the available industry breakdown of wage growth from the AWE is quite limited, so there isn’t very much scope to pick out the key industries. But the re-weighting might be relevant in future. For instance, the increase in the National Minimum Wage in April 2024 will affect some industries more than others, and as we know, not all industries are equally important for CPI.
Correction (15 February 2024): This post has been corrected due to a calculation error in the weighting of the retail and wholesale industries. This principally affects Chart 3, though the other charts have also been updated. The author apologises for the error and any inconvenience caused.
Josh Martin works in the Bank’s External MPC Unit.
If you want to get in touch, please email us at bankunderground@bankofengland.co.uk or leave a comment below.
Comments will only appear once approved by a moderator, and are only published where a full name is supplied. Bank Underground is a blog for Bank of England staff to share views that challenge – or support – prevailing policy orthodoxies. The views expressed here are those of the authors, and are not necessarily those of the Bank of England, or its policy committees.
US inflation rate is declining – no case for further rate rises
It’s Wednesday and I have comments on a few items today. I haven’t been able to write much today because the power has been down after the dramatic storms yesterday in Victoria damaged the network and caused absolute chaos (see below). Power is mostly back on now (which is why this post is later than…
New research report finds massive price gouging across all sectors of Australian economy
Over the last few years, the RBA has been emphatically denying that price gouging from corporations with significant market power has been driving the movements in the inflation rate. They knew that if they conceded that reality then there would be no justification for the 11 interest rate hikes they have introduced since May 2022.…
Vibecession over
Though I’m certainly not the first to make this observation, it looks like the “vibecession” is over. The term was coined in June 2022 by multimedia economic analyst Kyla Scanlon (drawing on Keynes but also the poetry of Charles Bukowski), who defined it as “a disconnect between consumer sentiment and economic data. So basically, the economy is doing fine, but people are absolutely not feeling fine.” By recent measures, people are starting to feel somewhat finer, if not bounce-off-the-walls fine.
The Conference Board’s consumer confidence index rose 6.8 points in January to its highest level since December 2021. The index is the summary of a monthly survey the organization has conducted since 1967 that asks people questions about the state of the economy, the job market, and their personal finances, both in the present and their expectations for the future. Separate indexes for the present and expectations questions are computed, and then averaged into a composite. The history is graphed below.
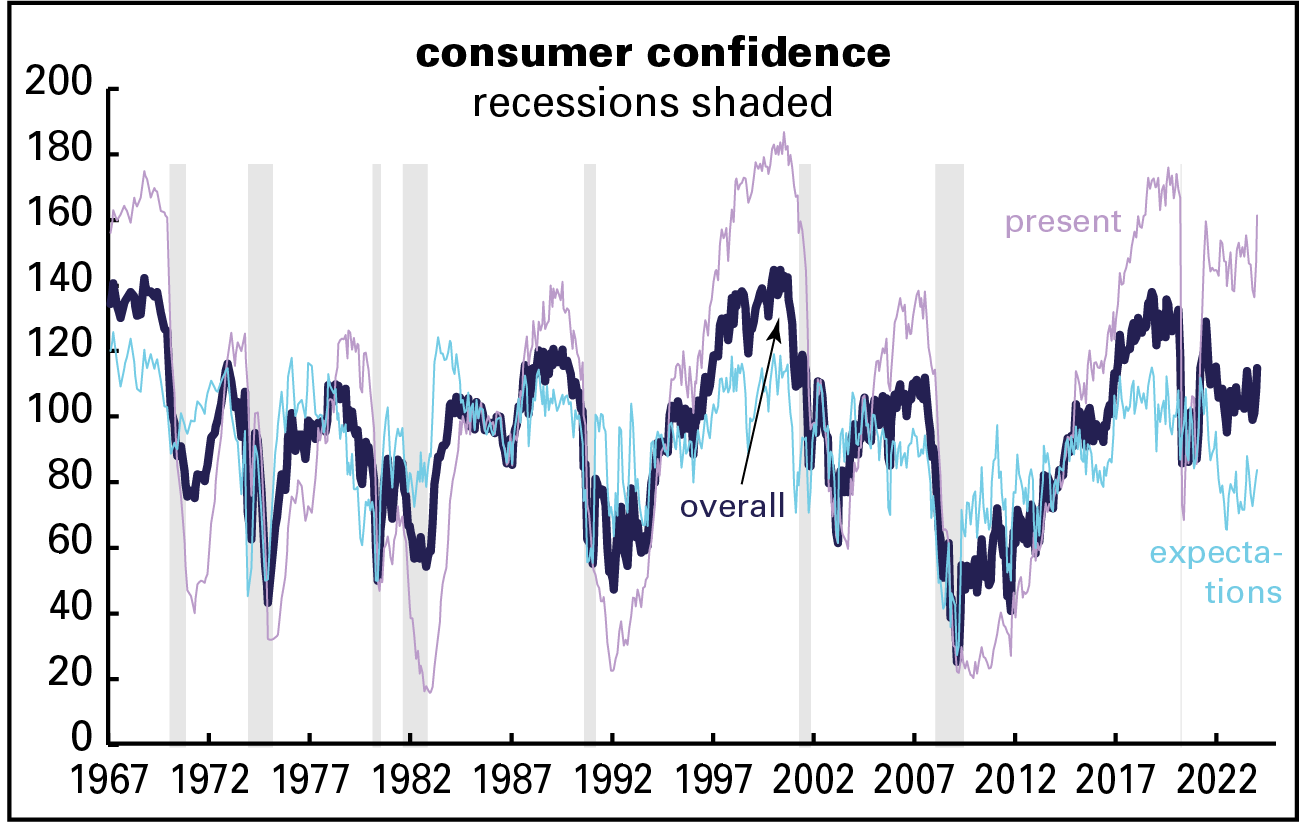
January’s rise in the composite was led by its “present conditions” component, up 14.1 points to the highest level since March 2020. Driving the rise were improving evaluations of the job market, as the gap between those reporting “job plentiful” and those reporting them “hard to get” expanded 8.4 points to 35.7 in favor of plentiful—very high by historical standards (higher than 94% of all the months in its 57-year history). Expectations, alas, are more muted.
Gallup agrees on the improvement, though not on its degree. The present component of their economic confidence index rose to its highest level since November 2021 in January, but it’s still negative on balance. (It’s computed as the difference between the share of respondents calling the economy excellent or good and the share calling it poor. Just 5% of respondents in the January survey called it “excellent,” and 22% “good.” Far more, 45%, called it poor. for a net of -18%.) The expectations side, while also net negative, is at its least negative level since September 2021. There’s no graph of these because there are often long stretches between surveys and such a graph would be ugly.
And another: the University of Michigan’s consumer sentiment measure (graph below) was up 9.1 from December on its preliminary January reading, reaching its highest level since July 2021. It was also led by evaluations of the present, though expectations were somewhat loftier than the Conference Board’s counterpart. Sentiment had really been plumbing the depths: in June 2022, the month Scanlon coined the term, the index hit 50.0, its all-time low in over seven decades of history—below the depths of the Great Recession. Not coincidentally, it was also the month of peak inflation.* The sentiment index’s full-year 2023 average was 8 points below the long-term recession average. January’s improved reading was nonetheless still almost 10 points below the average of all business cycle expansions since 1952.
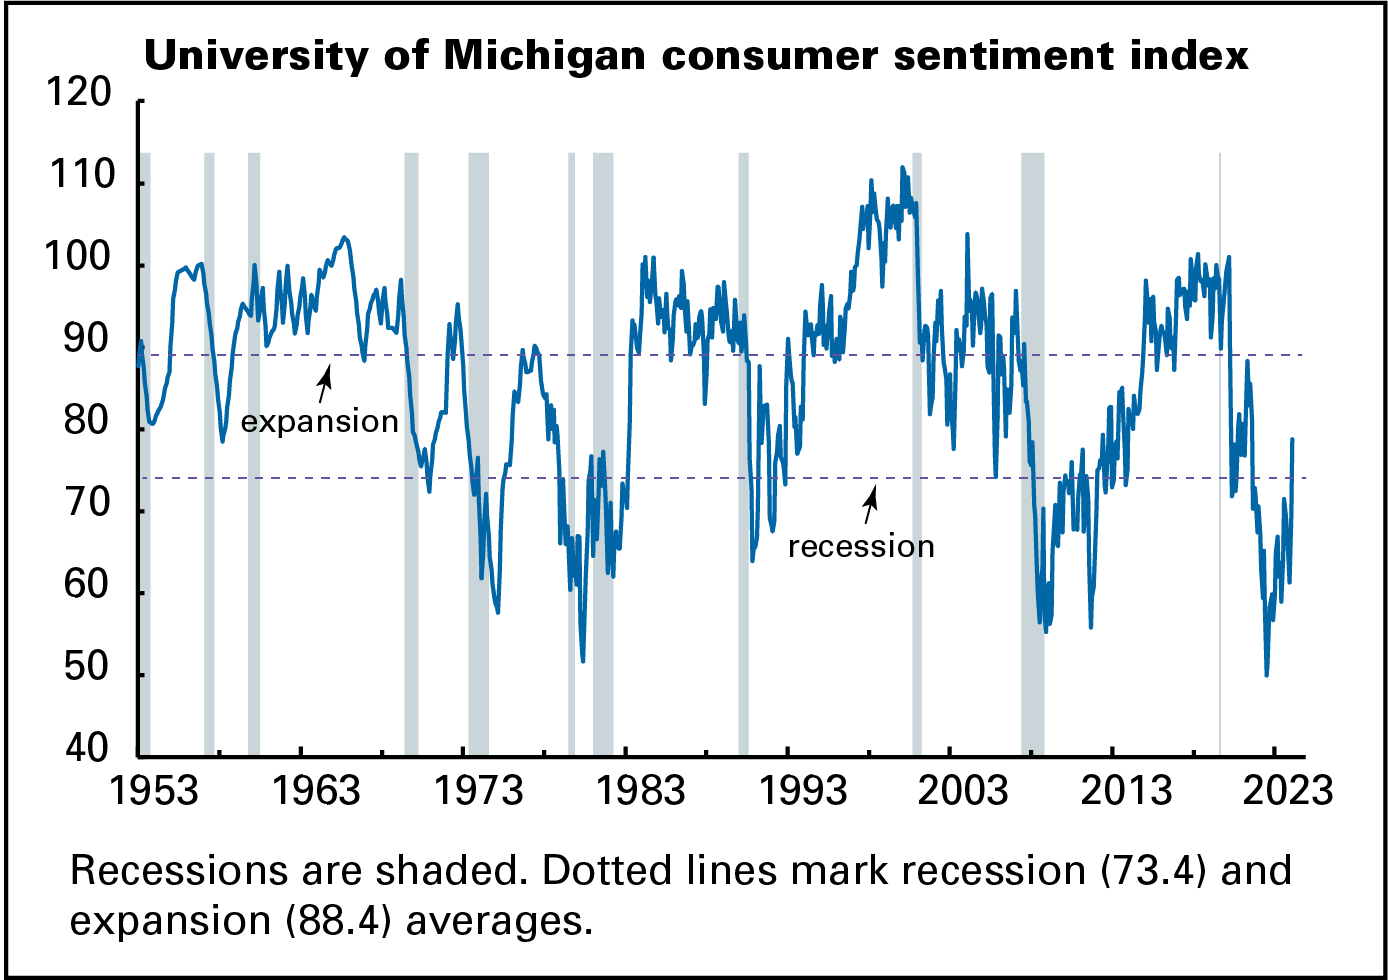
inflation down
Much of this improvement in outlook is the result of the decline in inflation, from 8.9% in June 2022 to 3.3% in December 2023, a fall of almost two-thirds. We hadn’t seen 8.9% in 42 years. December’s 3.3% is above the 1990–2019 average of 2.5%, but not profoundly so.
Along with the decline in actual inflation has come a decline in expected inflation. I’ve long thought that instruments that measure “expectations” are mostly about the present and recent past and have little or no prognostic content. (As the graph below shows, expectations for price increases over the next twelve months generally track the experience of the previous twelve.) Instead, expectations can be read as a measure of a subjective state—in this case, how established inflation feels as a part of life, what the current norm is.
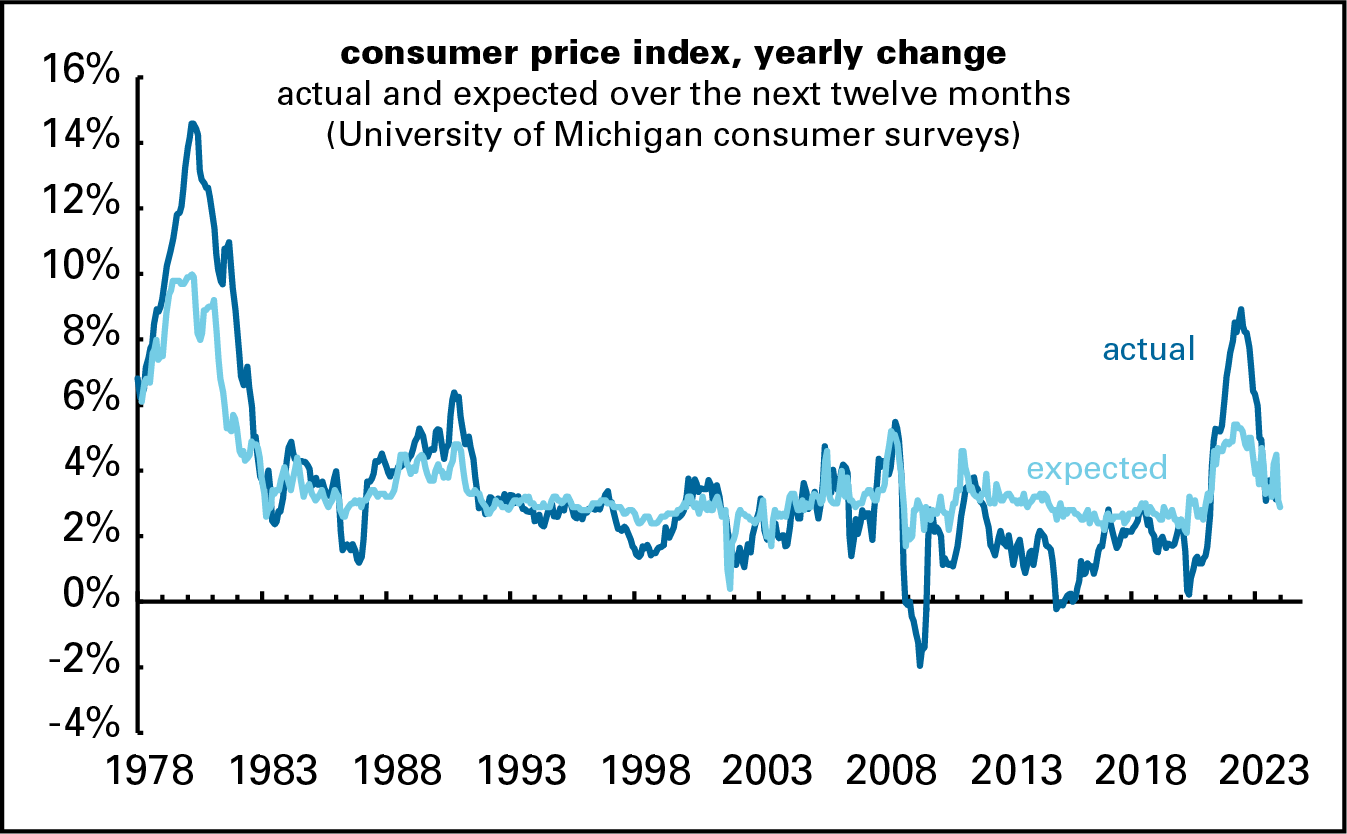
By this measure, inflation’s psychological grasp looks to be slipping. As the graph shows, expectations for the next year have come down along with actual inflation, from over 5% in mid-2022 to 2.9% in January.
That matters a lot—people hate inflation! Liberals and leftists tend to dismiss inflation as a concern of anal-retentive reactionaries, but that badly misreads popular opinion. I made this argument at some length in my long Jacobin article on inflation, but here’s another piece of evidence to add to that: Scanlon cites a Morning Consult poll that found 63% of consumers prefer prices going down to their income going up. Economists natter on about “real” (inflation-adjusted) income, but they may not be giving enough weight to the price part.
partisan coda
Speaking of the Michigan sentiment numbers, the improvement in outlook over the last couple of months crosses partisan lines, but the gap between Democrats and Republicans widened. Partisan gaps have long been visible in the survey, but they were much less dramatic than they’ve been since January 21, 2017. During the Obama years, Dems’ consumer sentiment ratings were about 18 points higher than Republicans’. During the Trump years, the gap more than doubled to 39 points, though it switched parties to favor Republicans. For first three of the Biden years, the parties flipped again, as Dems’ evaluations exceeded Reps’ by 35 points, even though nothing had changed by conventional economic measures. Independents, not surprisingly, split these differences.
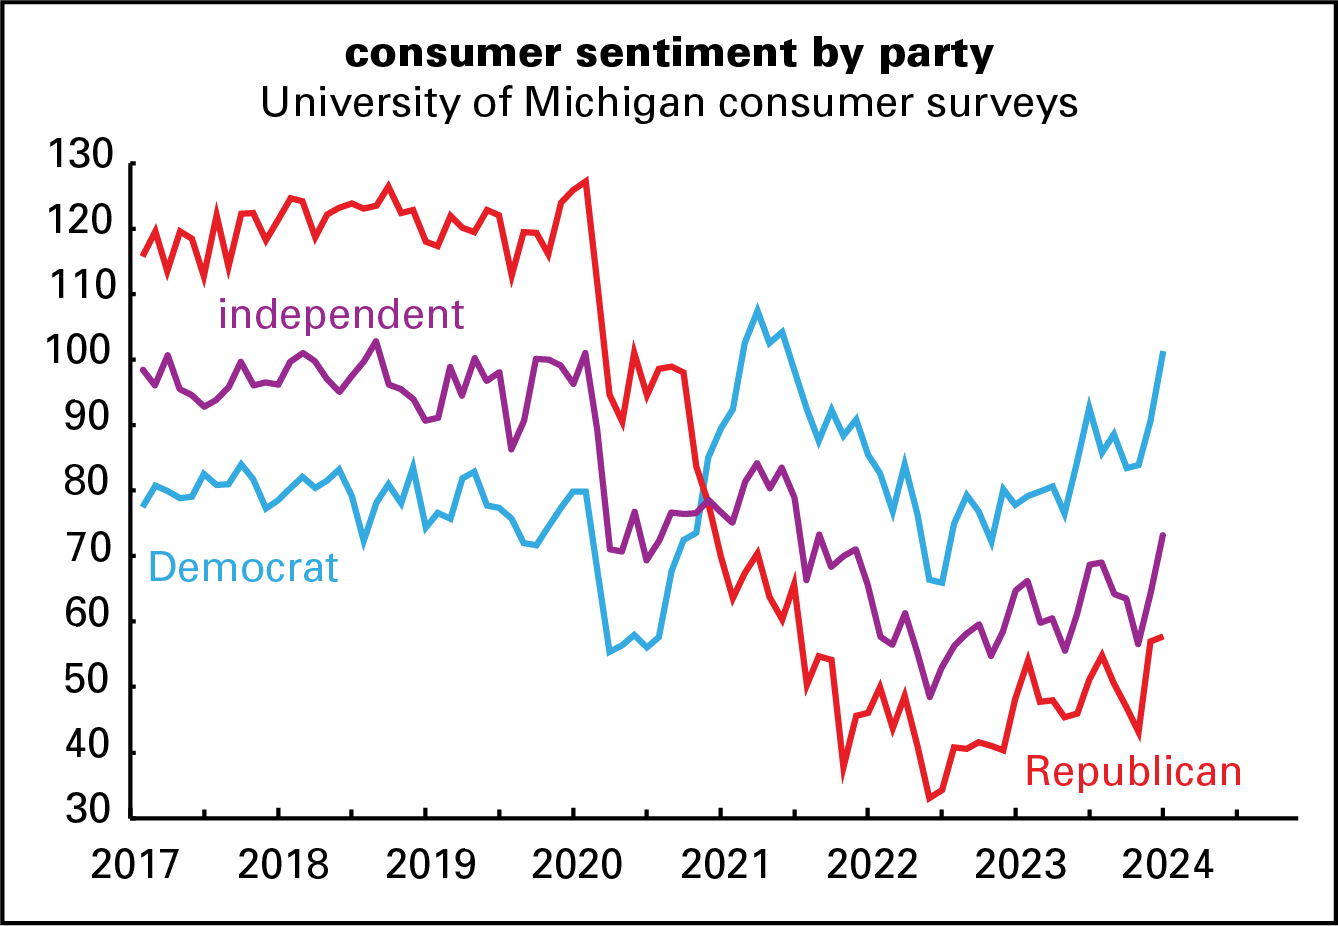
Between November 2023 and January 2024, both parties saw strong increases in their evaluations of the economy, but Dems, up 17 points, were more enthusiastic than Reps, up just 15. So the gap widened to 44 points.
Much of the lift to the overall sentiment measure for Republicans—over three-quarters of it—came from expectations, not evaluations of the present; perhaps they’re hopeful about November’s election results.
Otherwise, the end of the vibecession might be good news for the hapless warmonger Biden, who needs some.
* In June 2022, when the sentiment measure was at its record low of 50.0, the unemployment rate was 3.6%. It was also the high for the recent inflation surge: 8.6%. In October 2009, when the unemployment rate was 10.0%, the worst reading of the Great Recession, the sentiment index was 70.6. But there was literally no inflation: for the year ending October 2009, the consumer price index was down 0.2%.