inequality
The empire of lies (and its consequences)
 Image by Gerd Altmann from Pixabay
“Let’s face it, the universe is messy. It is nonlinear, turbulent, and chaotic. It is dynamic. It spends its time in transient behavior on its way to somewhere else, not in mathematically neat equilibria. It self-organizes and evolves. It creates diversity, not uniformity. That’s what makes the world interesting, that’s what makes it beautiful, and that’s what makes it work.”
Donella H. Meadows, Thinking In Systems: A Primer
The Mont Pelerin Society was founded in 1947 by Friedrich von Hayek. The tenets of its faith can be described best in the words of David Harvey in his book ‘A Brief History of Neoliberalism’.
“Neoliberalism is in the first instance a theory of political economic practices that proposes that human well-being can best be advanced by liberating individual entrepreneurial freedoms and skills within an institutional framework characterized by strong private property rights, free markets, and free trade.”
Whilst it took a few decades for its proponents to win their arguments, since the 70s it has formed the backbone of political and economic thought that has driven public policy globally through national governments, and institutions like the IMF and the World Bank.
Mrs Thatcher was enamoured by Hayek and his book ‘Road to Serfdom’ which she read as an undergraduate at Oxford. It is reputed that at a Conservative party policy meeting, she took her copy of another of his books, ‘Constitution of Liberty’ from her bag, slammed it down on the table and declared, ‘This is what we believe’. From there, everything is history. Her insistence that ‘There is no such thing as public money, there is only taxpayers’ money’, provided the modus operandi for successive governments of all political stripes to implement policies that reflected Hayek’s political and economic beliefs.
It led to, as David Harvey also went on to say, ‘ the financialisation of everything … A power shift away from production to the world of finance’. It has overseen over those same decades the dismantling of public services, social security, deregulation and the breaking of labour and the unions, as well as huge increases in poverty and inequality.
Inevitably, this toxic philosophy has made the rich elite richer in what can only be described as an ongoing wealth grab. It has been responsible for the exploitation of some of the poorest countries in the world, who not only have had to watch as their own resources are plundered by Western corporations, but also have had to watch as their own existence is threatened by a climate crisis, not of their own making, but which keeps the profits of global corporations flying high.
Let’s fast forward to the present, where the consequences lie before us in all their horror. With a particular emphasis here on the UK and the effects of neoliberal dogma on the lives of citizens, which has resulted not just from decades of such policies, but the last 13 years of Tory austerity which have done so much damage to the public and social infrastructure meant to provide the foundations for a functioning economy and societal well-being.
Analysing the effects of austerity on the population, a study compiled by the Glasgow Centre for Population Health and the University of Glasgow (and debated in the House of Lords) ‘adds to the growing evidence of the profound and deeply concerning changes to mortality trends observed as a result of UK Government economic ‘austerity’ policies. These have slashed billions of pounds from our public services and social security system with devastating impacts. Without support, people have been swept up by a rising tide of poverty and dragged under by decreased income, poor housing, poor nutrition, poor health and social isolation – ultimately leading to premature deaths…’
The response to the pandemic which began in 2020, highlighted as nothing ever could, the effects of cuts to public spending on public health systems and social care services, and the inhumane effects of welfare reform on working people and some of the most vulnerable in our society. The human reality is shocking.
Last week’s Autumn Statement exposes not just that cruelty, but also highlights the false narrative upon which that cruelty is meted out by politicians, and the economic dogma which directs public policy and spending.
Jeremy Hunt was clear; ‘There’s no easy way to reduce the tax burden. What we need to do is take difficult decisions to reform the welfare state’. His Chief Secretary to the Treasury was even blunter, people must ‘do their duty’, get back to work, sick or not, or face the consequences, lose benefits. As if these were choices to be made by the sick or those struggling with their mental health, and not political choices borne of a political class that has lost its way.
As Ayla Ozmen at the Charity Z2K commented, ‘There is no evidence to support the idea that there are fully remote jobs available that are suitable for these groups. This is simply a cut for those of us who become seriously ill or disabled in the future and need the support of social security, and risks worsening people’s health and pushing them further from work.’
Frances Ryan, disability campaigner and journalist at the Guardian put it even more starkly. ‘The Tories are back monstering people on benefits.’ This was nothing to do she said, ‘with saving money’, but was, in fact, ‘performative cruelty’, ‘nothing more than a raid on the income of those who already have the least whilst being demonised by those with the most.’
We have, as she said, been here before. People died. It can be no accident. This is a deliberate choice by a currency-issuing government to inflict harm on those least able to defend themselves, and to be frank, those who have suffered more than their fair share of the politics of austerity and cuts to public spending.
The Spectator predictably chose a divisive headline for this month’s publication, ‘Britain’s welfare system is out of control,’ writing that, ‘the number of Britons claiming sickness benefits – 2.8 million – will still keep rising to 3.4 million by the end of the decade. Reversing this trend, it seems, is a political impossibility.’
The more accurate headline would have been, ‘Tory Government out of control’, since the reality is that government austerity lies at the heart of an ailing nation. A government displaying psychopathic tendencies couching its plans in the language of reducing debt, taking a responsible approach to public spending, and rewarding hard work. Language reminiscent of George Osborne in 2012 when he commented in a radio interview that it was, ‘unfair that people listening to this programme going out to work, see the neighbour next door with the blinds down because they are on benefits. The nasty party isn’t back, it never went away. It is depressing to note, equally, that the opposition, in its rhetoric about fiscal discipline and growing the economy to raise the revenue for public services, promotes the same lie that drives their proposed policies.
Household budget economics rules the roost. A narrative that is designed to deceive by shifting responsibility away from the government, to create an ever more divided society, whilst at the same time shovelling more and more wealth upwards as data published by Oxfam at the beginning of the year demonstrated. That the richest 1% of Britons hold more wealth than 70% of Britons.
This is a government already using its currency-creating powers to serve wealth, but covering its tracks by using a false narrative about how it spends, so it can justify cuts to spending on serving the public purpose. Whilst the poorest must ‘do their duty’ and sacrifice themselves on the pyre of austerity, this as the evidence shows, does not apply if you are wealthy, a corporation, or an arms manufacturer selling death and destruction. The, ‘there is no alternative’ slogan applies only if you are poor, hungry, homeless, old or sick. See the contradictions?
It’s not much better in the Labour camp.
Whilst Wes Streeting, the Shadow Secretary of State for Health & Social Care, on the same neoliberal wavelength, proposes an open door for the private healthcare sector, (ignoring the fact it’s been open for decades, in fact since Tony Blair), he claimed a few weeks ago that ‘the money simply isn’t there to continue NHS spending because the Tories have trashed the public finances.’
Streeting, like his Labour colleague Rachel Reeves, promoting the myth that there is a finite pot of money and the Tories have spent it all, which will require some fiscal discipline, which will in turn involve not being able to afford free school meals for all children, or a functioning NHS.
‘I’m not going to be able to magic money out of nowhere’, said Rachel Reeves with her serious, former economist at the Bank of England face. As if she couldn’t possibly know how government really spends. But in a horrible game of, ‘we’ll be fiscally responsible one-upmanship,’ she is effectively denying monetary reality and condemning people to more hardship. Well, not the corporations of course. They’ll come in for some star partnership treatment. Labour’s proposal for a ‘partnership’ with business, as if somehow it doesn’t have already the monetary tools it needs to create an economy that works for everyone, not just those that have sufficient power and influence to swing the rules in their favour.
Next up, we have Gordon Brown, a former Chancellor of the Exchequer for Labour, who just prior to the Autumn Statement, and in the same vein, advocated partnerships with big business and charities to address the growing poverty that has arisen out of the politics of Tory austerity and neoliberal dogma.
Heady words like Corporate Social Responsibility were banded about by the man who advocated deregulation and a light-touch government, praising the City of London for its achievements. All just before the financial sector came crashing down around our ears and the government was forced to bail it out, using those elusive currency-issuing powers the current government is denying long-suffering citizens. His light touch led to the politics of austerity by the Tory government, the dismantling of public and social infrastructure, cruel welfare reform, food banks and growing homelessness, all based on a false narrative of how government spends.
Dear Gordon, we don’t need big business or charity to sort out this avoidable disaster. With 3.8 million people, including one million children, destitute in Britain today, what we need is a government that is politically motivated to change things for the better to give people the tools they need to live productive lives that enrich their existence and not condemn them to a life of penury. We need politicians to embrace how money really works, not the lie that passes for reality.
While Gordon Brown calls on companies to step in, the new Chair of the Charity Commission vowed to crack down on ‘squeamish charities accepting donations’ and accused wealthy British citizens of ‘not pulling their weight when it came to charitable giving.’ A little bit of philanthropy does you good, apparently, not to mention reducing the tax bill.
Putting aside the proposed crackdown on squeamish charities in an era when ethical and moral considerations have been thrown out of the window by a political class more concerned with serving the dictates of the US hegemon and its corporate masters, anyone demonstrating such values should be praised not castigated.
As we have said many times before, charities are a failure of government. Their purpose is to mitigate a rotten economic system designed to exploit and impoverish some people and enrich others. Whether charities like the Trussell Trust feeding hungry people or the myriad charities supporting the homeless living in temporary accommodation or on the street, they function as an alternative to state involvement in serving public purpose. This was the point of Cameron’s ‘Big Society’ to shift responsibility into the wider society.
Such charities are now struggling to meet growing need as a result of government-imposed austerity that has ironically led to cuts in their funding. This is a government-created vicious circle deriving from the politics of austerity, the demonisation of deficit and public debt, and a market-driven neoliberal ideology that favours a small state, with charitable provision of welfare, and privatised public services acting not in the interests of citizens, but rather the state acting as a cash cow for private profit.
It also derives from a toxic ideology of personal responsibility designed to absolve the state from any duty of care for its citizens. This has involved blaming and shaming people for what we are told is personal failure. Just what the neoliberal doctor ordered to keep citizens poor, downtrodden, divided and struggling to survive by forcing them to sacrifice themselves to preserve the economic status quo for the already excessively wealthy.
A status quo which is transferring more wealth into the hands of corporations and wealthy individuals who, in turn, are then invited to do their bit and donate to charity. As if people are dependent on their philanthropy, their goodwill, on their largesse to keep body and soul together. A fabrication that rests on the false notion that the government needs taxes to spend.
This narrative is constructed on the lie that government spends like a household budget, that its sources of funding are taxation or borrowing. Economic well-being depends on neither. It depends on a government that puts the needs of citizens as a priority to create a functioning economy and a healthy, thriving society. That in turn depends on the political decisions a government makes as the currency issuer, imposer of taxes and legislator. Decisions about how real resources are distributed and to whom. In fact, we are talking here about the sort of society we as citizens want to live in.
Instead, we are told that our economic and social well-being is dependent on the state of the public finances, whether the economy is growing enough to afford public services, or for those on the left, how much we will need to tax the wealthiest to pay for public infrastructure.
We are living a destructive lie that is readily promoted by a self-serving media. The daily round of nonsense that passes as monetary reality.
Whether it’s Philip Inman in the Guardian suggesting that since the days of cheap investment credit are over, chancellors must find a different source of revenue, namely increased taxes, The Times implying that a lower borrowing bill will give the Chancellor some ‘fiscal headroom’, as if he’s suddenly found a few more quid in the pot to spend or deliver a tax cut because of it. Or indeed, Andrew Neil, who explained to his attentive audience in the Daily Mail, that ‘the bond markets are where governments go to borrow money from investors […] when their spending plans exceed the amount they are able to raise in tax.’ Apparently, we need to ‘free ourselves from their tyranny.’ ‘The era of big government, cheap money and untrammelled borrowing is over’ he said.
Presenting the public accounts as if the government were a business or private individual that has to cut back in hard times or borrow to fund its spending because it has a limited pot of money. The Treasury gnomes working hard to balance the books, find some spare money down the back of the sofa, rob Peter’s department to pay Paul’s, or beg the capital markets for a loan. All rubbish.
As Professor Bill Mitchell notes, ‘debt issuance is a redundant part of the process… a hangover from past currency arrangements.’ Clearly the media hasn’t caught up. This is the con that drives public policy decisions and leads people to believe that government’s primary role is to balance the accounts, rather than deliver a functioning, stable and sustainable economy, the corollary of which is societal well-being.
The bottom line is that lower interest rates for government borrowing make no difference at all to the capacity of government to spend, or indeed cut taxes.
The cost has been high and will continue to be. Neither of the main political parties frames its role as an initiator of public purpose, rather they think they are Dicken’s Mikawber borne again. We have two political parties obsessed with fiscal discipline, whilst at the same time aiming to shift responsibility into the wider economy and society through partnerships with business or charity. Full on neoliberalism. Full on Hayek vision for government and society.
This is how the government and ones in waiting, and media lackeys like Andrew Neil keep the public trapped in a lie about how government spends, by presenting government finances as a household budget. It serves as an ideologically driven justification for cuts to public spending, not because it’s necessary, but to keep the neoliberal stranglehold in place which is about dismantling public infrastructure and enslaving citizens. This is what Andrew Neil supports. This is the big lie that distorts reality and will ultimately be the death of us if we fail to grasp its fundamental importance to our survival.
According to this narrative, money is a scarce commodity. Which it is not. The role of government is not to balance the books, but to serve its citizens. To decide how real resources are distributed and to whom, through its spending, taxation and legislative policies. It should be pretty obvious by now, who the current beneficiaries are, the corporate estate, the military machine, and those with excessive wealth, power and influence.
This distribution is a political choice driven by ideological aims and it is regrettable that those seeking progressive change are still caught like rabbits in Mrs Thatcher’s headlights. There is a lot at stake. A liveable planet where world citizens have their needs met and crushing poverty and inequality cease to be the norm. When a Labour spokesperson justifies Rachel Reeves watering down her green transition pledges because of the state of the public finances, and that fiscal rules were more important than any policy, you know that without a doubt we are in serious trouble.
What happens in the wider economy starts at the top with the government and flows down resulting from its spending, taxing and legislative policies. We need to understand that the state of the public finances is an irrelevant sideshow and that the real test is what government has done to ensure a functioning and balanced economy, that respects the planet and the human beings that depend on it for their survival.
We need as a matter of urgency to understand what a functioning democracy, with an informed public no longer willing to throw themselves on the pyre of harmful austerity could achieve. The art of the possible to save humanity from a political class intent on serving the interests of a small group of people, not to mention their own interests through the revolving door. As Jason Hickel notes in his book ‘Less is more: How degrowth will save the world.
“When people live in a fair, caring society, where everyone has equal access to social goods, they don’t have to spend their time worrying about how to cover their basic needs day to day – they can enjoy the art of living. And instead of feeling they are in constant competition with their neighbours, they can build bonds of social solidarity.”
It is currently no more than an aspiration for change, but the struggle must continue to make it a reality for humanity.
Join our mailing list
If you would like GIMMS to let you know about news and events, please click to sign up here
Support us
The Gower Initiative for Money Studies is run by volunteers and relies on donations to continue its work. If you would like to donate, please see our donations page here.
Share
Tweet
Messenger
Share
tumblr
Viber icon
Viber
The post The empire of lies (and its consequences) appeared first on The Gower Initiative for Modern Money Studies.
The choice is simple. Do we run the economy in the interests of those who are in need, or for the benefit of those who already have a great deal but want more?
This tweet quotes Kemi Badenoch MP, our trade secretary and a person even more desperate to lead the Tories than Suella Braverman. The video, made at the Covid inquiry last week, is illuminating, but the tweet says all you need to know about what she said:
Kemi Badenoch, "We don't have a cure for poverty. If we did, we would have done it already" #CovidInquiry pic.twitter.com/0dX9NsJ8tC
— Farrukh (@implausibleblog) November 24, 2023
This is a perfect example of the nonsense that the far-right say to support their cause, knowing that what they are saying is completely untrue.
Of course, we know how to tackle poverty. As a matter of fact, there is less poverty in the UK than once there was. As a result, unless you are wilfully blind, it is apparent that we do know how to tackle this issue.
The answers are relatively straightforward. Apart from paying decent benefits and appropriate pensions (neither of which happens in the UK at present) we also need to:
- Build affordable social housing in sufficient quantity that everybody might enjoy it.
- Ensure that essential public services, such as water, gas, electricity, telecoms and transport are affordably accessible to everyone.
- Guarantee free healthcare and social care from cradle to grave.
- Deliver high-quality education so that people can, if they wish, change their situations and are encouraged to do so.
- Have a policy of full employment at a living wage.
All of this is possible, and entirely affordable. All we need to do is:
- Have a genuinely progressive tax system of the sort that I describe in the Taxing Wealth Report 2024.
- Turn private savings into public capital in the way that I describe here.
- Have a government that makes the meeting of need its highest priority, rather than the servicing of the wants of the clients of the financial services industry the focus of its attention.
- Have a government that believes in a genuinely mixed economy, which has to be the basis of our future prosperity. The market-based dogma of the right, and the state-based dogma of the left, cannot solve the problems of poverty: only mixing the best can do that.
Such a government would also, necessarily, be focussed on delivering sustainability, but those now in poverty do not threaten that. The threat to our planet comes from the wealthy.
It is simply not true that we do not know how to eliminate poverty. We could achieve that goal. The reality is that Kemi Badenoch wants us to think that we cannot, because those who support her believe it would threaten them if we were to do so.
The choice is simple. Do we run the economy in the interests of those who are in need, or for the benefit of those who already have a great deal but want more? That is the political question that we need to answer now. To add piquancy, human life can only survive one of those choices. That should make deciding fairly easy. Unless you are Kemi Badenoch and the Labour Party, that is.

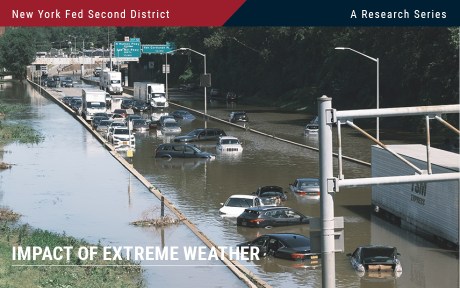
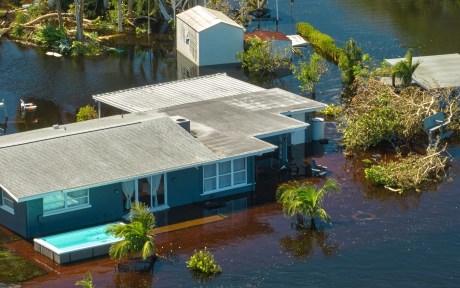
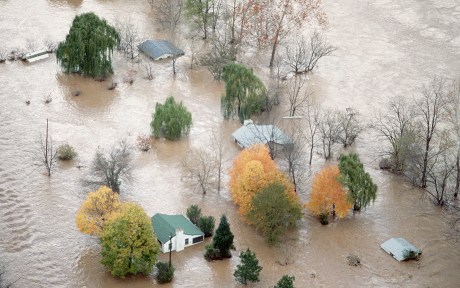
Flood-Prone Basement Housing in New York City and the Impact on Low- and Moderate-Income Renters
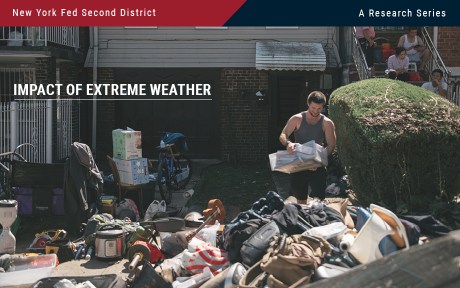
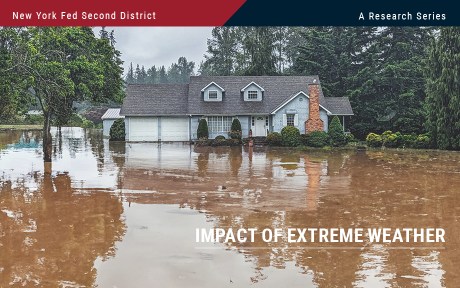
Hurricane Ida, which struck New York in early September 2021, exposed the region’s vulnerability to extreme rainfall and inland flooding. The storm created massive damage to the housing stock, particularly low-lying units. This post measures the storm’s impact on basement housing stock and, following the focus on more-at-risk populations from the two previous entries in this series, analyzes the attendant impact on low-income and immigrant populations. We find that basements in select census tracts are at high risk of flooding, affecting an estimated 10 percent of low-income and immigrant New Yorkers.
Flood Risk and Basement Data
For our analysis, we combine data on flood risk from the Federal Emergency Management Agency (FEMA) and the First Street Foundation. FEMA’s data primarily rely on coastal and riverine flooding, using the 100-year return period to determine a neighborhood’s flood risk. The First Street Foundation data measure river (fluvial) and precipitation-driven (pluvial) flooding as well as coastal flooding, enabling us to identify flood-prone areas in addition to FEMA’s 100-year floodplain. Flood Factor is determined at the property level and “specifically looks at the likelihood of 1 inch of water reaching the building footprint of a home at least once within the next 30 years.” (Please see First Street Foundation for a description of the 1-10 scale for flood factor.)
Basement dwellings are among the most vulnerable to flooding. We focus on the basement structures that are most likely to be in residential buildings, using the PLUTO (Primary Land Use Tax Lot Output) Database, which contains tax lot-level information about properties and land in New York City. We adopt and modify a data-filtering process from the Citizens’ Housing and Planning Council’s (CHPC) Hidden Housing report and divide basements into “flood-prone” and “viable” categories using flood risk metrics from FEMA and First Street Foundation.
Do Low-Income Renters Face Elevated Risk from Floods?
New York City’s rental housing market is notoriously tight, with a recent report suggesting that the city is facing its worst affordability crisis in two decades. Based on this report, half of the city’s households lack the means to cover the monthly cost of housing, food, healthcare, and transportation, creating challenges for low- and moderate-income (LMI) populations in finding affordable housing. In addition to these general challenges, low-income renters are particularly vulnerable to natural hazards. Standard renters’ insurance does not cover flood damage, and federal relief programs, in the event of a federal disaster declaration, offer only basic coverage for renters.
The map below examines two variables, flood risk and the share of LMI renters by census tract, with deeper shades of green identifying tracts with the highest flood risk and highest share of low-income renters. Deep gold indicates areas that house dense populations of LMI renters but are less flood-prone. Deep blue indicates areas that have the highest flood risk but have less dense populations of LMI renters.
The tracts with the highest flood risk for low-income renters include east Bronx, East Harlem, the east coast of Staten Island, southern and eastern Brooklyn, the Lower East Side of Manhattan, and southern Queens. The census tracts at highest risk tend to be located on coastlines, but there are several census tracts in Brooklyn, Queens, and the Bronx that are located more inland and show a moderate to high risk of pluvial flooding for low-and-moderate income renters. This is a notable danger, as pluvial flooding is not always captured in the flood information used to qualify households for disaster assistance and insurance and suggests that asymmetric information on flood risk may put certain LMI renter households at increased risk of property damage and broader harm from inland flooding.
Flood Risk and LMI Renter Populations in New York City
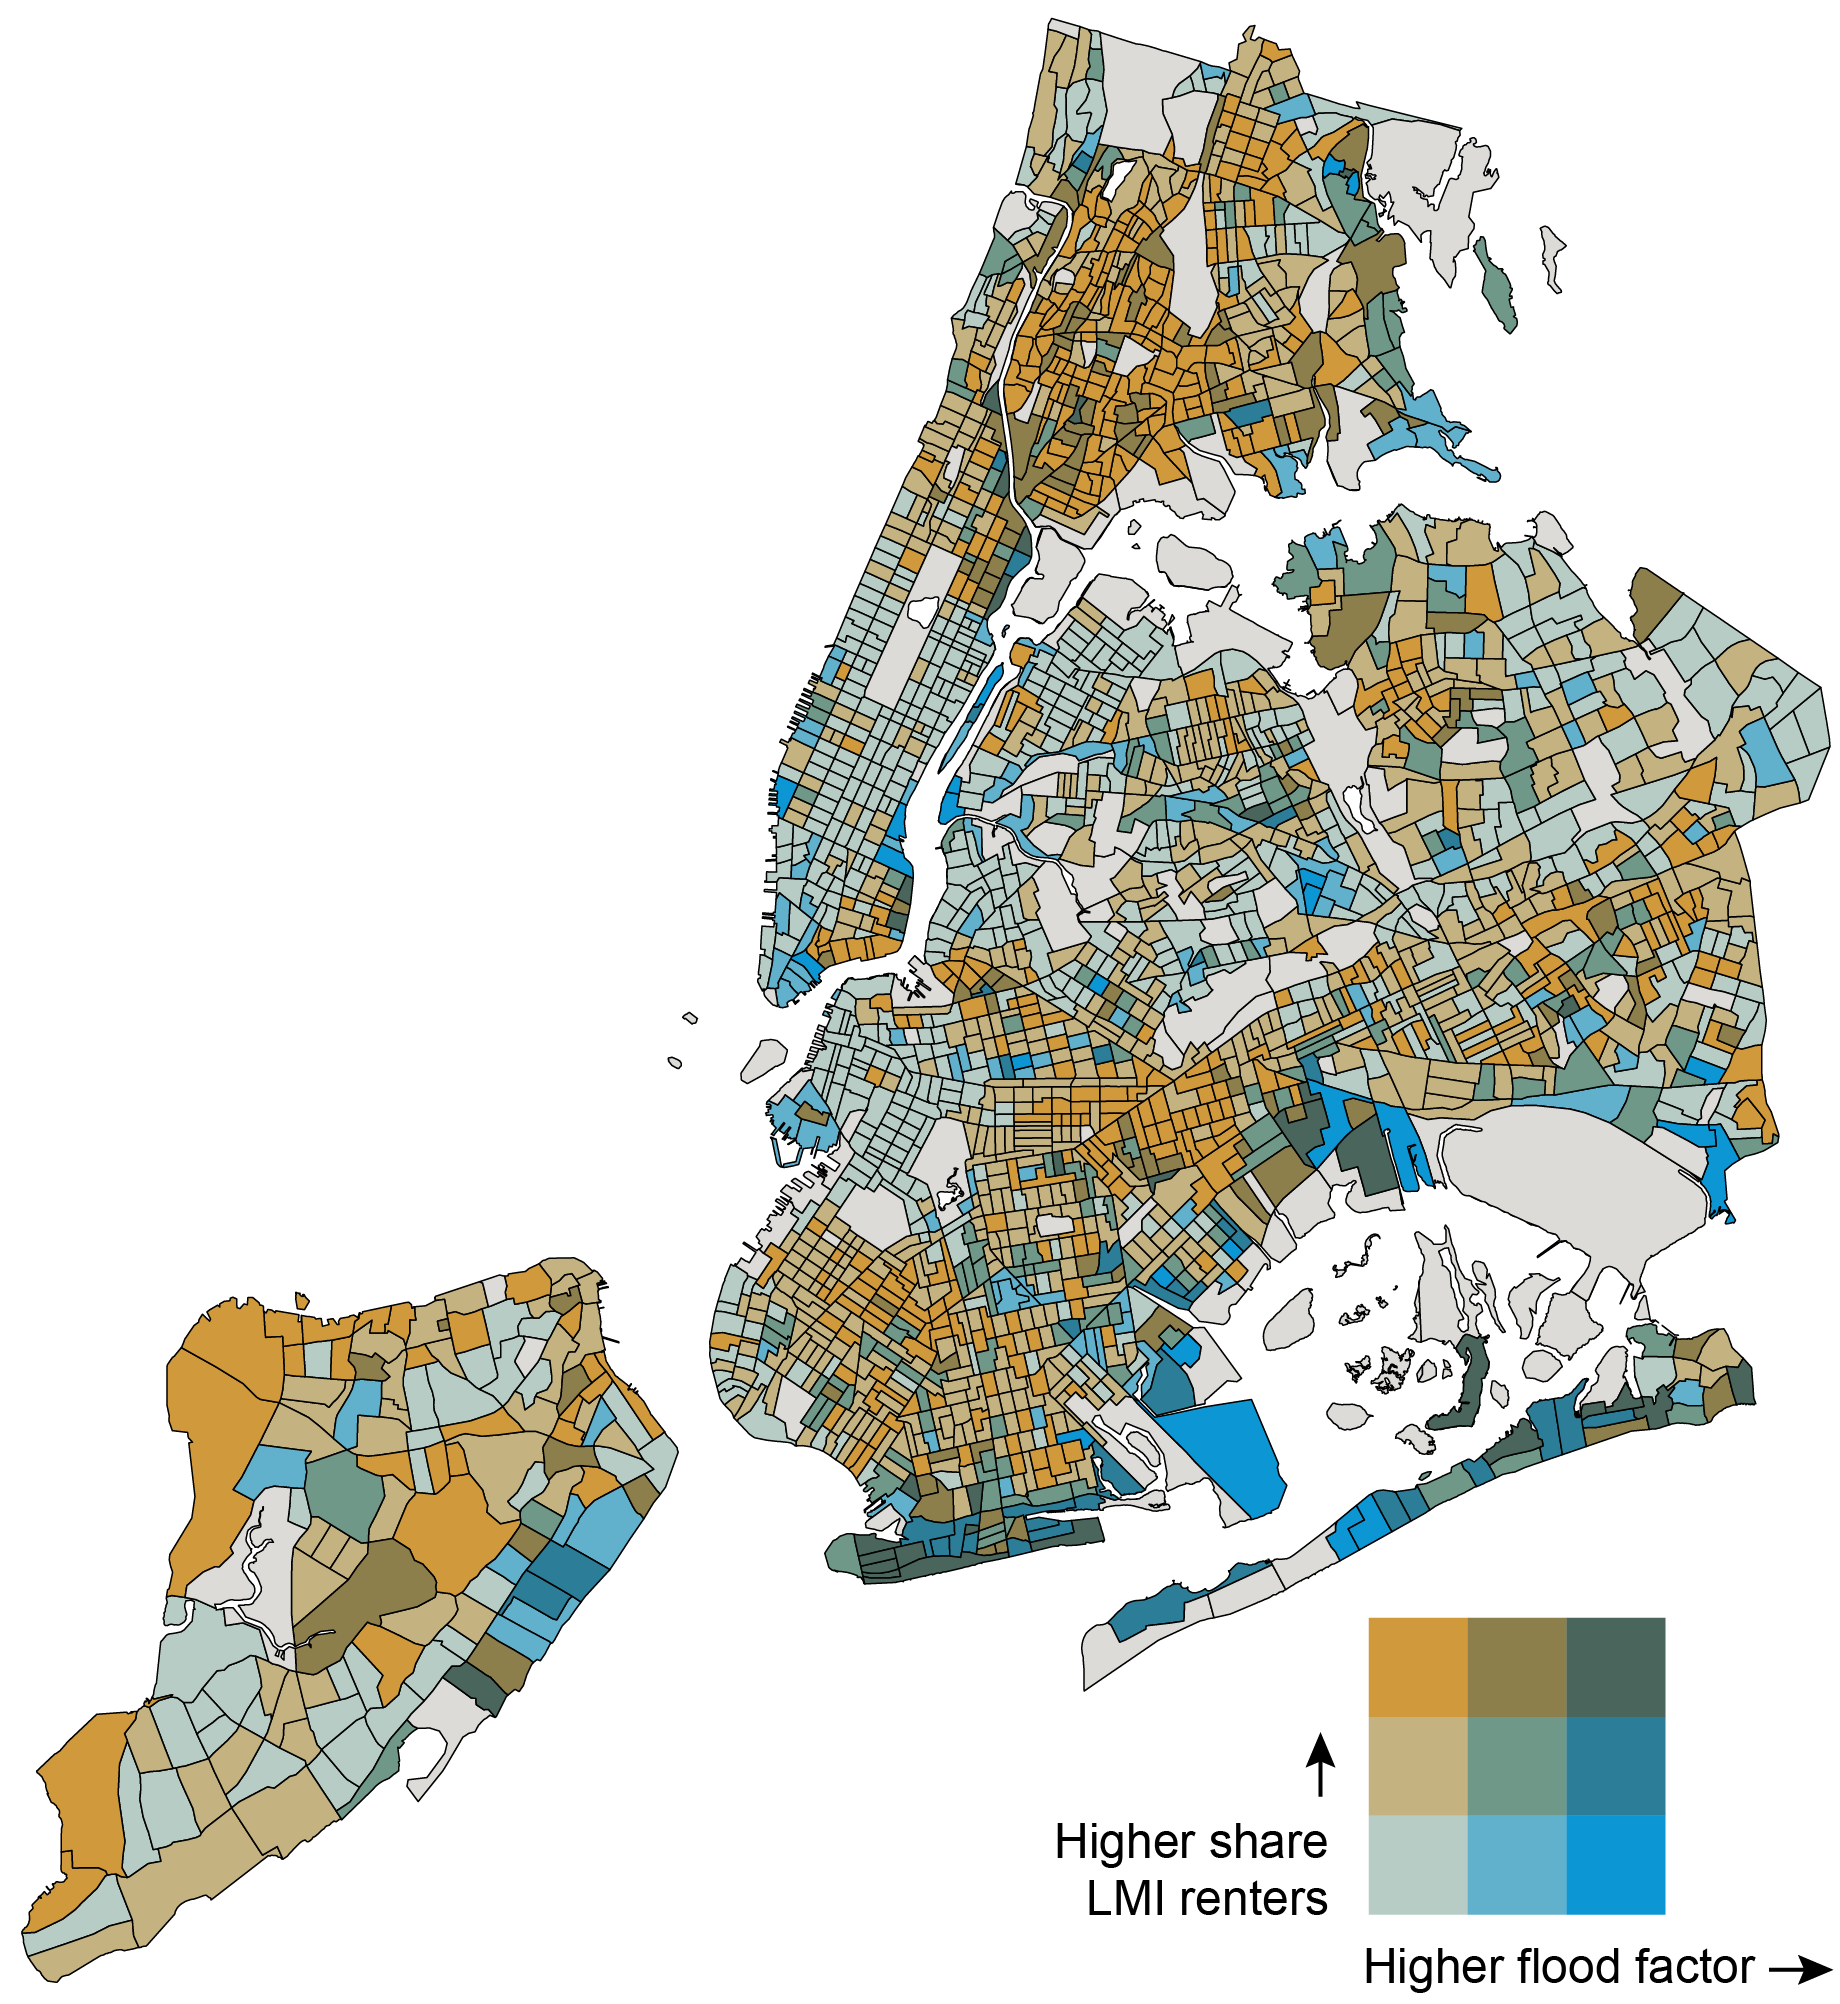
Sources: American Community Survey (5-year, 2017-2021); First Street Foundation (2021).
Notes: Dark gray census tracts indicate areas for which data are not available. The numeric buckets for the flood factor axis are 0-35 percent, 35-67 percent, and 67-100 percent. The numeric buckets for the share of LMI renters axis are 0-31 percent, 31-64 percent, and 64-100 percent.
Where Is Basement Housing Stock Relative to Flood Risk and LMI Renter Populations?
For neighborhoods with higher populations of LMI renters and/or acute housing shortages, basement housing can serve as an important part of the housing stock. Average rental costs of basement dwellings are lower than above-ground apartments, with savings estimates of 20 percent or more. This makes basement apartments attractive to thousands of New Yorkers.
In the table below, we estimate the amount of basement housing stock that is vulnerable to flooding. This refers to basements in census tracts where the flood factor defined by First Street Foundation is greater than 3 (encompassing moderate, 3-4, to severe, 9-10, flooding) and the share of properties in a Special Flood Hazard Area is greater than 10 percent.
Flood Risk Implications for LMI Renters in Potential Basement Housing Stock
NYC Census Tracts Low Share LMI Renters (<30%)Moderate to High Share LMI Renters (≥30%)Low Flood Risk
(< 3 FF, < 10% SFHA)45,403 basements
(19% of all basements) 168,668 basements
(72% of all basements) Major to High Flood Risk
(≥ 3 FF, ≥ 10% SFHA)503 basements
(<1% of all basements)4,065 basements
(2% of all basements) Sources: American Community Survey (5-year, 2021); First Street Foundation (2021).
Notes: Percentages in the table do not add up to 100 percent, because the basements that may either be in a census tract where the flood factor is less than 3 and the share of SFHA properties is greater than or equal to 10 percent OR a census tract where the flood factor is greater or equal to 3 and the share of SFHA properties is less than 10 percent are not included in the potential basement housing stock, but are included in the total number of basements.
The most vulnerable census tracts are those with higher shares of LMI renters and higher flood risk, and we estimate that potentially 4,065 basement units are likely to house LMI renters in areas at risk of major to severe flooding. This is eight times the number of basement units (503) located in high flood risk census tracts with smaller populations of LMI renters, where there is a smaller likelihood of basement unit residents. While basements in areas with high flood risk and higher shares of LMI renters constitute 2 percent of all basements in the city, 72 percent of all basements in the city occur in areas with low flood risk and higher shares of LMI renters, indicating a presence of safer and more viable basement housing stock for LMI renter populations that have limited housing choice.
Basement Housing: Viable versus Flood-Prone
We categorize census tracts (and the basements in them) as “flood-prone” if they have a flood factor of 3 or above (encompassing moderate, 3-4, to severe, 9-10, flooding) and/or if more than 10 percent of the properties in the census tract fall in a Special Flood Hazard Area (SFHA). “Viable” basements are in census tracts that have a flood factor of below 3 and less than 10 percent of properties in an SFHA.
The map below indicates that basement dwellings in most census tracts in New York City are viable, but census tracts vary in the density of basements. High concentrations of viable basements are in southern Staten Island, southern Brooklyn, southern Queens, and Flushing, while higher concentrations of flood-prone basements are in East Harlem, eastern Staten Island, the east and south Bronx, and, notably, parts of southern Brooklyn, southern Queens, and Flushing.
Density of Potential Basement Dwellings by Census Tract (Viable vs. Flood-Prone)
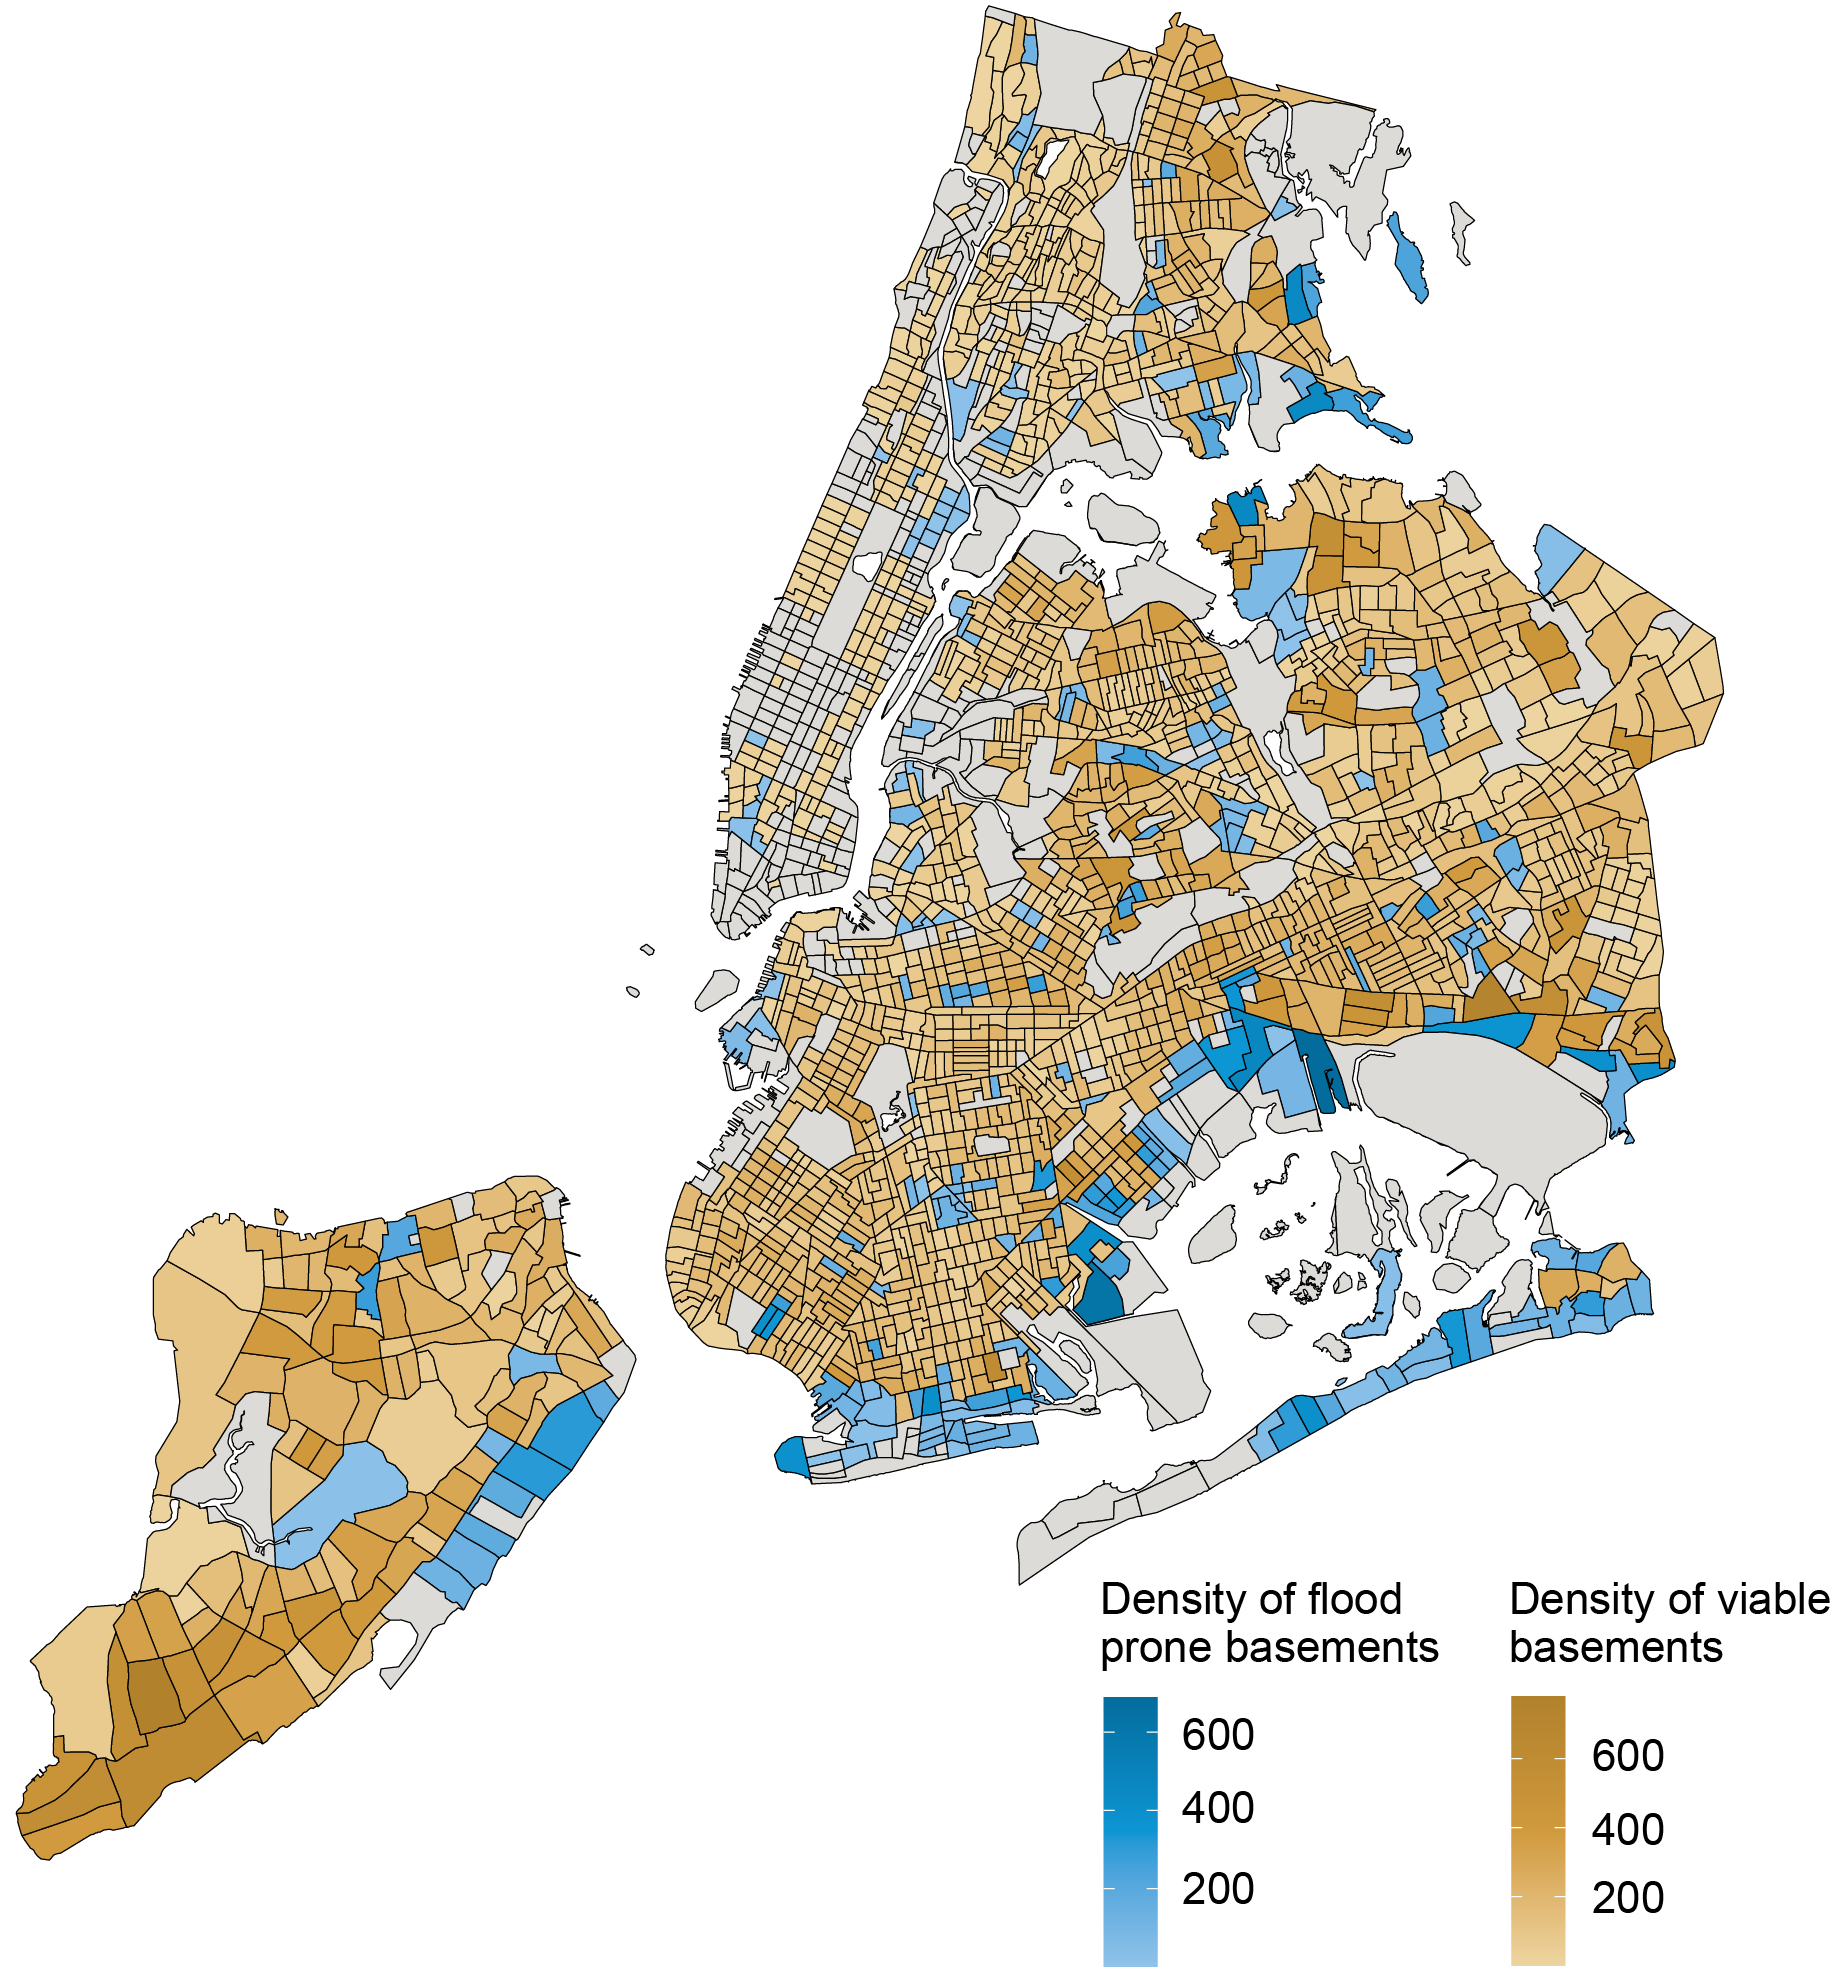
Sources: PLUTO NYC Database version 23.1; First Street Foundation (2021); FEMA.
Notes: Dark grey areas indicate that there are no identifiable potential basement dwellings in the census tract, given the data filtering process we undertook.
The highest densities of flood-prone basement housing still occur along the coastlines of the city, particularly in Canarsie, Coney Island, Howard Beach, and East New York. These basement units are also in census tracts with severe to extreme flood risk scores.
In the table below, we calculate the shares of low- and moderate-income people, immigrants, and racial/ethnic minorities living in a flood-prone census tract. Approximately one in ten LMI individuals, immigrants, and racial/ethnic minorities in New York City live in a flood-prone census tract, a significant share of each of these populations. The informality of basement housing often means that the city’s most vulnerable communities are likely to take up residence in these dwellings.
Flood Prone Census Tracts by Demographics
LMIImmigrantsRacial/Ethnic MinoritiesCensus Tracts with
Flood-Prone Basements 9%9%10%Sources: American Community Survey (5-year, 2017-2021); First Street Foundation (2021); FEMA.
Note: Percentages reflect the share of the total population in tracts with moderate to high flood risk (flood factor of 3 or above and >10 percent of properties in a Special Flood Hazard Area).
Conclusion
This blog post introduces new data to estimate with greater precision the flood risk to basement apartments in New York City. We show that these risks potentially affect roughly 10 percent of LMI individuals, immigrants, and racial and ethnic minorities. For expanded analysis and insights, please look for our upcoming report on flood risk and basement housing in New York City, to be released by the New York Fed’s Community Development & Outreach Group.
As the formalization of the city’s basement housing stock is debated, it is important to consider accounting for both inland and coastal flooding and the vulnerability of LMI, immigrant, and minority populations in assessing viable basement housing stock. The importance of considering the impact of extreme events like hurricanes on activity in the Federal Reserve’s Second District is further examined in the next blog post of this series, which examines the impact of hurricanes on Puerto Rican banks.

Claire Kramer Mills is a community development research manager in the Federal Reserve Bank of New York’s Communications and Outreach Group.

Ambika Nair is a community development outreach analyst in the Federal Reserve Bank of New York’s Communications and Outreach Group.

Julian di Giovanni is the head of Climate Risk Studies in the Federal Reserve Bank of New York’s Research and Statistics Group.
How to cite this post:
Claire Kramer Mills, Ambika Nair, and Julian di Giovanni, “Flood-Prone Basement Housing in New York City and the Impact on Low- and Moderate-Income Renters,” Federal Reserve Bank of New York Liberty Street Economics, November 17, 2023, https://libertystreeteconomics.newyorkfed.org/2023/11/flood-prone-baseme....
Moving Out of a Flood Zone? That May Be Risky!
How Do Banks Lend in Inaccurate Flood Zones in the Fed’s Second District?
Disclaimer
The views expressed in this post are those of the author(s) and do not necessarily reflect the position of the Federal Reserve Bank of New York or the Federal Reserve System. Any errors or omissions are the responsibility of the author(s).
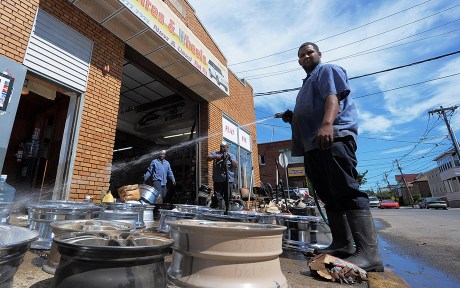
Small Business Recovery after Natural Disasters in the Fed’s Second District
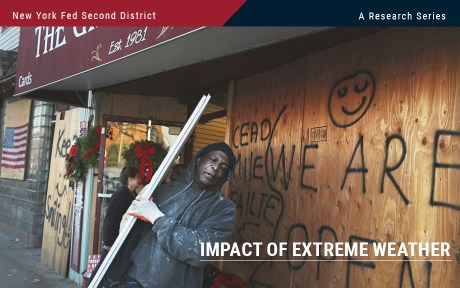
A previous Liberty Street Economics post found that minority-owned small businesses in the Federal Reserve’s Second District have been particularly vulnerable to natural disasters. Here we focus on the aftermath of disasters (such as hurricanes, floods, wildfires, droughts, and winter storms) and examine disparities in the ability of these firms to reopen their businesses and access disaster relief. Our results indicate that while white- and minority-owned firms remain closed for similar durations, the latter are more reliant on external funding from government and private sources to cope with disaster losses.
How Often and How Long Do Small Businesses Close after Disasters?
As in the previous post, we consider small businesses in three states in the Second District (New York, New Jersey, and Connecticut, omitting Puerto Rico and the U.S. Virgin Islands due to limited data availability), using data from the Small Business Credit Survey (SBCS) for the period 2021-22. The SBCS asked disaster-affected firms: “Did your business temporarily close because of this natural disaster?” For the firms that responded yes, the survey posed a follow-up question asking for an estimate of the length of time for which they were temporarily closed. These responses likely represent lower bounds for closure since a firm that closed temporarily at the time of survey completion may end up remaining closed for longer than reported.
Sixty percent of small businesses overall in our sample that reported natural-disaster-related losses were forced to close temporarily because of a disaster. Fifty-five percent of minority-owned firms were temporarily closed as compared to about 65 percent of white-owned firms (see the left panel of the chart below); minority-owned firms were closed for similar durations as white-owned firms, with 90 percent of businesses shut down for three months or less (see the right panel of the chart below). A firm is defined as minority-owned if at least 51 percent of the firm’s equity stake is held by a minority (that is, an Asian, Black, Native American, or Hispanic) owner. A firm is defined as white-owned if at least 50 percent of the firm’s equity stake is held by non-Hispanic white owners. Race/ethnicity categories are not mutually exclusive.
Minority- and White-Owned Firms in the Region Remain Closed for Similar Durations
Firm temporarily closed
Percent
{"padding":{"auto":false,"left":22},"color":{"pattern":["#046C9D","#D0993C","#9FA1A8","#656D76","#8FC3EA","#0D96D4","#B1812C"]},"interaction":{"enabled":true},"point":{"show":false},"data":{"groups":[],"labels":false,"type":"bar","order":"desc","selection":{"enabled":false,"grouped":true,"multiple":true,"draggable":true},"x":"","rows":[["White, N=177","Minority, N=205"],["64.54","55.24"]]},"legend":{"show":true,"position":"bottom"},"tooltip":{"show":true,"grouped":true},"axis":{"rotated":false,"x":{"show":false,"type":"category","localtime":true,"tick":{"centered":false,"culling":false,"fit":true,"outer":true,"multiline":false,"multilineMax":0},"label":{"text":"","position":"outer-center"},"categories":["Firm temporarily closed"]},"y":{"show":true,"inner":false,"type":"linear","inverted":false,"tick":{"centered":false,"culling":false},"padding":{"top":3,"bottom":0},"primary":"","secondary":"","label":{"text":"","position":"outer-middle"},"max":70,"min":0},"y2":{"show":false,"inner":false,"type":"linear","inverted":false,"padding":{"top":3},"label":{"text":"","position":"outer-middle"}}},"grid":{"x":{"show":false,"lines":[],"type":"indexed","stroke":""},"y":{"show":true,"lines":[],"type":"linear","stroke":""}},"regions":[],"chartLabel":"Percent","trend":{"show":false,"label":"Trend"},"zoom":false,"subchart":false,"download":true,"downloadText":"Download chart","downloadName":"chart"}
Closure length
Percent
{"padding":{"auto":false,"left":22,"bottom":0},"color":{"pattern":["#046C9D","#D0993C","#9FA1A8","#656D76","#8FC3EA","#0D96D4","#B1812C"]},"interaction":{"enabled":true},"point":{"show":false},"data":{"groups":[],"labels":false,"type":"bar","order":"desc","selection":{"enabled":false,"grouped":true,"multiple":true,"draggable":true},"x":"","rows":[["White, N=106","Minority, N=121"],["90.15","90.83"],["9.85","9.17"]]},"legend":{"show":true,"position":"bottom"},"tooltip":{"show":true,"grouped":true},"axis":{"rotated":false,"x":{"show":false,"type":"category","localtime":true,"tick":{"centered":false,"culling":false,"fit":true,"outer":true,"multiline":false,"multilineMax":0},"label":{"text":"","position":"outer-center"},"categories":["Less than three months","Over three months"]},"y":{"show":true,"inner":false,"type":"linear","inverted":false,"tick":{"centered":false,"culling":false},"padding":{"top":3,"bottom":0},"primary":"","secondary":"","label":{"text":"","position":"outer-middle"}},"y2":{"show":false,"inner":false,"type":"linear","inverted":false,"padding":{"top":3},"label":{"text":"","position":"outer-middle"}}},"grid":{"x":{"show":false,"lines":[],"type":"indexed","stroke":""},"y":{"show":true,"lines":[],"type":"linear","stroke":""}},"regions":[],"chartLabel":"Percent","trend":{"show":false,"label":"Trend"},"zoom":false,"subchart":false,"download":true,"downloadText":"Download chart","downloadName":"chart"}
Sources: Federal Reserve Banks, 2021 and 2022 Small Business Credit Surveys.
Notes: The left panel includes only firms that reported disaster-related losses. For respondents in each race/ethnicity category, the bars plot the percentage of firms that responded yes to the question: “Did your business temporarily close because of this natural disaster?” The panel on the right further limits the sample to firms that temporarily closed because of a natural disaster. For each race/ethnicity category, this panel shows the percentage of firms that were closed for the length indicated on the x-axis at the time of survey completion. A firm is defined as minority-owned if at least 51 percent of the firm’s equity stake is held by a minority (that is, an Asian, Black, Native American, or Hispanic) owner. A firm is defined as white-owned if at least 50 percent of the firm’s equity stake is held by non-Hispanic white owners. Race/ethnicity categories are not mutually exclusive. An observation is excluded from the sample if it is missing a response to the question or if the owner’s race is not observed. The sample pools employer and nonemployer firms. Responses by employer and nonemployer firms are weighted separately on a variety of firm characteristics to match the national population of employer and nonemployer firms, respectively. To construct a pooled weight, we use the employer (nonemployer) weight for the sample year if the firm is an employer (nonemployer). The surveys were fielded between September and November of 2021 and 2022.
This result seems surprising given the finding in the previous post that losses from natural disasters make up a greater share of total revenue for minority-owned firms, a fact suggesting that minority-owned firms were more likely to be closed longer. In contrast, in the national sample, we find that minority-owned businesses were disproportionately likely to be closed for more than three months. One explanation may be that different minority businesses were closed for different lengths. Indeed, in the national sample, Black-owned and Hispanic-owned businesses were closed for longer than white-owned and Asian-owned businesses, consistent with results in a 2022 post. Because we aggregate across minority groups due to the small sample sizes in the data, we may be unable to identify those minority businesses in the sample that were particularly adversely affected by disasters and forced to remain closed for extended periods of time.
What Funding Sources Do Small Businesses in the Region Access for Disaster Relief?
Greater access to financial relief following a disaster may mitigate the need for small businesses to remain closed for an extended period following disasters. The SBCS asked respondents that reported disaster losses to indicate the source(s) that they relied on to cope with their losses. Firms could select from multiple options as shown in the table below. A similar fraction (16 percent) of white- and minority-owned firms relied on disaster insurance funds. Among disaster-affected firms, minority-owned businesses disproportionately relied on government relief funds (such as, Federal Emergency Management Agency (FEMA), Small Business Administration (SBA), or other agencies). Thus, 20 percent of minority-owned firms relied on federal relief and 17 percent on state/local relief (versus 15 percent and 12 percent of white-owned firms, respectively). They were also more heavily dependent on donations, crowdfunding, or nonprofit grants: 17 percent of minority-owned firms rely on these sources as compared to just 1 percent of white-owned firms. Minority-owned firms also depend on non-government loans: 24 percent relied on private debt as compared to only 8 percent of white-owned firms. The national sample also indicates the greater reliance of minority-owned firms on external funding, whether from government or private sources (with the exception of private insurance).
Disparities in Funding Sources to Assist with Disaster
Share of AllShare of White-Owned FirmsShare of Minority-Owned FirmsFunding Sources(s) Relied On:Insurance0.15 0.160.16Federal disaster relief funds (e.g., FEMA, SBA)0.170.150.20State/local government disaster relief funds0.140.120.17Donations, crowdfunding, or nonprofit grants0.070.010.17Debt/loans (other than gov’t loans)0.140.080.24Other0.030.050.00Did not rely on external funds0.550.630.41Observations376180196Sources: Federal Reserve Banks, 2021 and 2022 Small Business Credit Surveys (SBCS).
Notes: This table includes only firms in the sample that reported disaster-related losses. The SBCS asks firms reporting losses: “Which of the following sources of funding did your business rely on to cope with these losses? Select all that apply.” The options are listed in the left column of the table. For each race/ethnicity category, the table reports the fraction of firms that relied on a particular source of funding. The columns do not sum to one because survey respondents had the option to select multiple sources. A firm is defined as minority-owned if at least 51 percent of the firm’s equity stake is held by a minority (that is, an Asian, Black, Native American, or Hispanic) owner. A firm is defined as white-owned if at least 50 percent of the firm’s equity stake is held by non-Hispanic white owners. Race/ethnicity categories are not mutually exclusive. An observation is excluded from the sample if it is missing a response to the question or if the owner’s race is not observed. The sample pools employer and nonemployer firms. Responses by employer and nonemployer firms are weighted separately on a variety of firm characteristics to match the national population of employer and nonemployer firms, respectively. To construct a pooled weight, we use the employer (nonemployer) weight if the firm is an employer (nonemployer). The surveys were fielded between September and November of 2021 and 2022.
While minority-owned firms disproportionately relied on external funding sources to cope with disaster losses, a higher fraction of white-owned firms did not rely on any external relief, consistent with their lower share of disaster-related losses in total revenues and their larger cash reserves.
Final Words
White- and minority-owned owned firms in the region remain closed for similar amounts and durations following disasters. However, minority-owned businesses are more likely to depend on external funding, both government and private, whereas white-owned firms are able to draw on internal reserves. These results underscore the importance to minority businesses of accessing affordable and timely relief after disasters. The following post considers this differential impact of natural disasters on more at-risk populations by studying how low- and moderate-income renters New York City are impacted by flooding.

Asani Sarkar is a financial research advisor in Non-Bank Financial Institution Studies in the Federal Reserve Bank of New York’s Research and Statistics Group.
How to cite this post:
Asani Sarkar, “Small Business Recovery after Natural Disasters in the Fed’s Second District,” Federal Reserve Bank of New York Liberty Street Economics, November 16, 2023, https://libertystreeteconomics.newyorkfed.org/2023/11/small-business-rec....
Small Business Recovery after Natural Disasters
The Adverse Effect of “Mandatory” Flood Insurance on Access to Credit
Disclaimer
The views expressed in this post are those of the author(s) and do not necessarily reflect the position of the Federal Reserve Bank of New York or the Federal Reserve System. Any errors or omissions are the responsibility of the author(s).
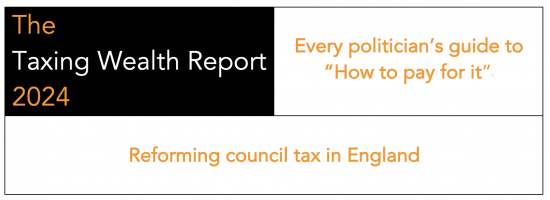
Taxing Wealth Report 2024: Council tax reforms
I have this morning published the latest note in my series that will make up the Taxing Wealth Report 2024. This latest note deals with a number of proposals for the reform of council tax in England. Broadly similar proposals could also be applied in Wales and Scotland which have slightly differing but not dissimilar council taxes, but not in Northern Ireland, which does not have this tax.
The summary of this note says:
Brief Summary
This note recognises that the council tax system used in England (of which variations are in use in Wales and Scotland, but not Northern Ireland) was always a hasty compromise when it was introduced in 1993, and that nothing has improved it since then.
For one pragmatic reason, however, it is not suggested that major reform of this tax take place as part of the whole package of reforms suggested in the Taxing Wealth Report 2024. That pragmatic reason is that there are many better ways of transforming the tax system as a whole to tackle the inequalities created by wealth in the UK than by expending a great deal of effort to totally redesign or even replace council tax. If the goal is to tackle the issue of wealth inequality in a systemic fashion then complete council tax reform has to come a long way down the list of potential reforms, even though the tax as it currently stands is very far from ideal.
That said, there is much that can be done within the parameters of the existing tax and this note proposes that if the goal is to more appropriately tax high and low-value properties, and in the process reduce the regressive nature of this tax, then this will require:
- Property revaluations.
- Increasing the number of bands used for property
- Changing the ratio of tax charged between top and bottom bands of council tax.
- Changing the exemptions available to those on benefits.
- Changing the treatment of second properties.
- Changing the treatment of vacant properties.
- Using central government grant-giving mechanisms to provide more support for local authorities in poorer areas whose revenues will fall as a result of these proposals.
The result could be a considerably fairer tax than we have at present, but not an optimal solution, which would have to wait for attention when more of the issues tackled in the Taxing Wealth Report 2024 have been addressed.
It is important to note that it is very unlikely that this proposal would raise additional tax revenues. There is very little scope to do that within the existing structure of this tax, not least because the number of high-value properties that are undertaxed at present is quite small, and any proceeds from taxing them more appropriately should be used to reduce charges elsewhere across the tax bands. The aim should be to create a fairer tax.
Discussion
Council tax is often noted as one of the more regressive taxes within the overall UK taxation system, whichever of the varieties is being referred to. The fact that very high-value properties are very obviously under-taxed by existing council tax arrangements is a point of irritation for many who would prefer a more progressive taxation system. However, that being said, only a tiny number of properties actually fall into the under-taxed category, and the potential for raising any significant additional revenue from this tax is decidedly limited. That is most especially the case if the excessive burden that this tax frequently imposes on those who are on low incomes, or who live in small properties, or who are on any form of benefit, is to be alleviated.
As such, the focus of the recommendations made here is to produce a fairer version of council tax in ways that would not impose significant political or financial cost, whilst creating significantly greater equity, with the necessary attention required to address inequality being focused elsewhere on other issues addressed by the Taxing Wealth Report 2024.
Cumulative value of recommendations made
The recommendations now made as part of the Taxing Wealth Report 2024 would, taking this latest proposal into account, raise total additional tax revenues of approximately £111.4 billion per annum.
The Overton Window: Homelessness
 Newsletter offer
Receive our Behind the Headlines email and we'll post a free copy of Byline Times
On 4 November, Suella Braverman took to the platform formerly known as Twitter.
“We cannot allow our streets to be taken over by rows of tents occupied by people,” the Home Secretary wrote. “Living on the streets,” she claimed was – for many – “a lifestyle choice.”
Hers is a strategy that aims to restrict tents for rough sleepers. This includes, Braverman hopes, creating a new civil offence to stop charities giving tents to homeless people.
Despite a long list of shocking statements she has recently come out with, this latest announcement seems one of the hardest to fathom. Especially given the rise and rise of homelessness under her and her predecessor’s governance.
By the end of March this year, there were just shy of 80,000 households facing homelessness in England. This is the highest number on record – up some 25% since a new recording system was put in place by the Government in 2018. This new recording system is not ideal for accountability. It makes it hard to work out how bad homelessness has become under the Conservatives since 2010.
What we do know is that, at the turn of the millennium, the figures show that there were 77,986 homeless households in temporary accommodation in England, Scotland and Wales. By 2010, after a decade of Labour rule, that number had dropped some 21%. That year, a Conservative prime minister took power and homelessness began to rise again. Between 2010 and 2018 the number of homeless households in the three nations rose to reach some 96,669 – an increase in eight years of 58%.
More recently, albeit using different ways to calculate the number, there were more than 104,000 households listed in England as being in temporary accommodation. According to the charity Shelter “this is at the highest level ever”.
“Historical records,” it says, “show that numbers were consistently under half what it is today in the decades before this.” There were also some 131,000 children recorded in temporary accommodation in England in March 2023.
Indeed, there are more homeless children in England than people in the British Army (112,000 regular and reserves).
After a point, such figures become meaningless. We begin to unsee the numbers and become numb to the homeless we do see. That’s why, in this picture, when Londoners pass by a man without glancing, it is hard to blame them. London’s streets are filled with too many like him.
Some cry in their desperation. “Give me money,” a young woman asks daily outside Shepherd’s Bush underground station. Others kneel in supplication, begging for alms. Others walk the tube lines, asking for pennies in a world where few carry cash anymore.
None seem to be doing it out of choice. Driven to that place by addiction, abuse or alienation, theirs are never lives that seem chosen.
Who would claim this man – huddled under a wet sleeping bag, ignored by passing crowds who have seen the numbers of unhoused swell and swell under years of Conservative rule – is there because of a "lifestyle choice"?
Perhaps the Home Secretary would say that she did not mean him. But who did she mean then? And where can they be found?
For as I walk the streets of London, I cannot seem to find them in my camera’s window.
The Evolution of Pragmatism in India: Ambedkar, Dewey, and the Rhetoric of Reconstruction – review
In The Evolution of Pragmatism in India: Ambedkar, Dewey, and the Rhetoric of Reconstruction, Scott Stroud examines the influence of the philosopher John Dewey on Bhimrao Ambedkar, a chief architect of India’s constitution. Stroud’s argument, grounded in archival research, persuasively demonstrates how Dewey’s pragmatism shaped Ambedkar’s thought and actions on historical, conceptual and methodological levels, writes Luis Cabrera.
The Evolution of Pragmatism in India: Ambedkar, Dewey, and the Rhetoric of Reconstruction. Scott R. Stroud. University of Chicago Press. 2023.
Find this book: ![]()
 There may be no more painstaking student of the intellectual journey of Bhimrao Ramji Ambedkar, India’s revered constitutional architect and anti-caste crusader, than Scott Stroud. No clue is too small – from Ambedkar practicing his signature on a scrap of paper, to notes in the margins of academic books he owned, to recollections of the avid notes he took as a doctoral student at Columbia – to be put under Stroud’s detective’s glass as he investigates the influence that John Dewey’s pragmatism came to exercise on Ambedkar’s thought and modes of action.
Ambedkar is venerated by the hundreds of millions of Dalits in India and the diaspora, and his birthday is officially observed in India. He also has increasingly been recognised as a significant legal and political thinker globally, with an ever-expanding literature chronicling his life and thought.
Ambedkar (1891-1956), was born into a Mahar Dalit (formerly ‘untouchable’) family, and he faced the deep exclusions typically attending that status. He went on, however, to earn doctoral degrees at both Columbia and the London School of Economics and was called to the bar at Gray’s Inn London. Returning to India, he gained fame as a champion of Dalit rights who, unlike his sometime rival Mohandas Gandhi, called for the total Annihilation of Caste – the title of his best-known work, published in 1936. Ambedkar ultimately was selected by inaugural post-Independence Prime Minister Jawaharlal Nehru to lead the drafting of India’s 1950 Constitution, and he later led hundreds of thousands of followers out of Hinduism into a Navayana Buddhism of his own design. Today, Ambedkar is venerated by the hundreds of millions of Dalits in India and the diaspora, and his birthday is officially observed in India. He also has increasingly been recognised as a significant legal and political thinker globally, with an ever-expanding literature chronicling his life and thought.
On Dewey’s death, [Ambedkar] would say in a letter to his wife Savita that, “I owe all my intellectual life to him. He was a wonderful man”
Stroud, a professor of Communication Studies at the University of Texas-Austin, who has previously explored Kant’s connections to rhetorical traditions and Dewey’s to aesthetics, focuses in The Evolution of Pragmatism in India on Ambedkar’s rhetorical and other inheritances from Dewey. Ambedkar first encountered Dewey at Columbia, and he was described as a voracious student of material presented in Dewey’s courses. On Dewey’s death he would say in a letter to his wife Savita that, “I owe all my intellectual life to him. He was a wonderful man” (Stroud 2023, 2).
While Stroud acknowledges that Ambedkar absorbed many other influences in his studies within India and without, he argues that:
To fully understand Ambedkar as an anticaste activist and theorist, and to see what informed his passion and creativity in regard to Buddhism, one must come to terms with Dewey and his form of pragmatism as Ambedkar saw, heard and read it early in his educational development. Pragmatism … represents a thread that runs through many of Ambedkar’s projects, activities and works (12).
Dewey (1859-1952) was in his mid-50s by the time Ambedkar arrived in New York in 1913, on scholarship from the hereditary ruler or Gaikwad of Baroda, in present-day Gujarat State. Dewey by that time had already served as president of both the American Psychological Association and American Philosophical Association, and he had made significant contributions in both fields, as well as to educational theory and practice.
Stroud’s focus is Dewey’s pragmatism, or emphasis on practical inquiry and experience in philosophy and its applications.
Stroud’s focus is Dewey’s pragmatism, or emphasis on practical inquiry and experience in philosophy and its applications. He explores its influence on and adaptation and development by Ambedkar. Specifically, he sets out to demonstrate that Dewey’s pragmatist thought was crucial to Ambedkar’s development in historical terms, “as the author of books that mattered to Ambedkar;” in conceptual terms of common ideals they shared, e.g., social democracy; and methodologically, “as sharing a process of reconstructive meliorism,” or an aim to improve social conditions (20). To make his case, Stroud draws on extensive archival work to identify such influences. He also does some outright detective work, tracking down in India books by Dewey and others that Ambedkar had owned, and in which he made notes. He relates discovering in Ambedkar’s well-worn copy of Dewey’s The Influence of Darwin on Philosophy, a scrap of paper on which the student Ambedkar had practiced his own signature – and on which he also practiced writing the name ‘John’ several times (6).
[Stroud] sets out to demonstrate that Dewey’s pragmatist thought was crucial to Ambedkar’s development in historical terms, ‘as the author of books that mattered to Ambedkar;’ in conceptual terms of common ideals they shared, e.g., social democracy; and methodologically, ‘as sharing a process of reconstructive meliorism,’ or an aim to improve social conditions.
Stroud begins his detective story in Chapter 1 with a focus on the detailed content of three courses Ambedkar took from Dewey at Columbia, reconstructed from Dewey’s own notes, handouts and Ambedkar’s and other students’ notes. Chapter 2 examines Ambedkar’s shift from economist and student of social phenomena to critic and advocate, with emphasis on a review article of a Bertrand Russell book he wrote, titled “Mr. Russell and the Reconstruction of Society.” For Stroud, the piece “marks the most evident start of Ambedkar’s project of reconstructive rhetoric, or his attempt to fashion and refashion problematic habits, customs, and institutions in readers or public through acts of persuasive speech and writing” (70).
Chapter 3 focuses on how Ambedkar turned that rhetoric more directly to a critique of the caste system, focusing on his testimony to the 1919 Southborough Committee on political representation for groups in imperial British India, in which he drew on and adapted material from Dewey’s seminal 1916 work, Democracy and Education. Chapter 4 examines Ambedkar’s own seminal text, Annihilation of Caste, and how it evinces both an adaptation and departure from, and development on, Dewey’s pragmatism. Chapter 5 focuses on Ambedkar’s approach to promoting social and political change, with emphasis on his modes of non-violent persuasion, education and reform. Such efforts are presented as culminating in Ambedkar’s leading hundreds of thousands of followers in conversion to Buddhism, a religion that he saw as fundamentally grounded in equality.
Stroud acknowledges throughout that Ambedkar had other influences besides Deweyan pragmatism […] but the book is indeed very persuasive that to fully understand Ambedkar, one must understand his relationship with Dewey.
Stroud acknowledges throughout that Ambedkar had other influences besides Deweyan pragmatism, and indeed alternate narratives could focus on how universalist moral traditions focused on principles of equality and rights were prominent in some of Ambedkar’s most powerful rhetoric and claims. But the book is indeed very persuasive that to fully understand Ambedkar, one must understand his relationship with Dewey. If there is one area in which the narrative might have been strengthened, it would have been in the initial establishment of Ambedkar’s importance as an agent of social and political change in India, and a thinker increasingly appreciated worldwide. A more extended treatment at the beginning of the book could have helped establish for those not already steeped in Ambedkariana why they should want to take such a relatively deep dive into it. Ambedkar’s legacy and importance become clearer throughout the book, however, and overall it is hard to imagine a more careful and compelling exploration of how Dewey’s thought influenced Ambedkar’s own thought and actions.
Note: This review gives the views of the author, and not the position of the LSE Review of Books blog, or of the London School of Economics and Political Science. The LSE RB blog may receive a small commission if you choose to make a purchase through the above Amazon affiliate link. This is entirely independent of the coverage of the book on LSE Review of Books.
Image Credit: PradeepGaurs on Shutterstock
Transition Risks in the Fed’s Second District and the Nation
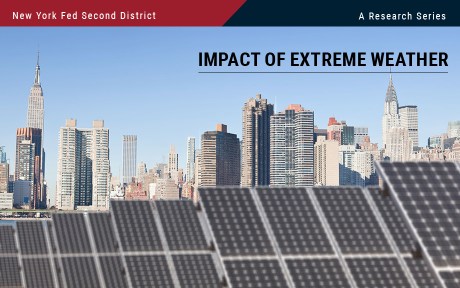
Climate change may pose two types of risk to the economy—from policies and consumer preferences as the energy system transitions to a lower dependence on carbon (in other words, transition risks) or from damages stemming from the direct impacts of climate change (physical risks). In this post, we follow up on our previous post that studied the exposure of the Federal Reserve’s Second District to physical risks by considering how transition risks affect different parts of the District and how they differentially affect the District relative to the nation. We find that, relative to other regions of the U.S., the economy of the Second District has considerably less exposure to fossil fuels. However, the cost of reducing even this relatively low economic dependence on carbon is still likely to be considerable.
How Exposed Is the Second District to Fossil Fuels?
Broadly speaking, “transition risks” are those costs and impacts associated with moving an economy away from a reliance on fossil fuels and making it resilient to the effects of climate change. Unlike physical risks, transition risks are a result of political or consumer actions that drive the economy. Transition risk can entail higher energy prices from retrofitting power grids, construction of new types of buildings, or even updates to transportation infrastructure to deal with a changing climate, as well as more direct costs associated with direct or indirect emissions pricing. Understanding the degree to which the Second District is affected by possible transition risks—especially when compared to other parts of the nation—is key to understanding the path ahead. For this analysis, we rely on measures of carbon intensity as a proxy for the degree of change that may be necessary.
In the map below, we consider data from the Energy Information Administration (EIA) on the carbon intensity of the economy in each U.S. state. This measure represents the number of metric tons of CO2 emitted in a given state per million dollars of GDP produced in that state. We see that New York State requires less than 250 metric tons of CO2 to produce a million dollars of GDP—a ratio that compares favorably to states with populations larger than New York, specifically to California, Florida, and especially Texas, which requires around 500 metric tons of CO2 to produce a million dollars of GDP. States such as West Virginia, Louisiana, and Wyoming that are much more reliant on energy production require emitting up to 1,000 tons of CO2 to produce a million dollars’ worth of output. The only area of the U.S. with an appreciably lower carbon intensity than New York State is Washington, D.C., likely because it is a metropolitan area with little mineral extraction. Looking at other parts of the Second District doesn’t change our conclusions, as Connecticut has essentially the same carbon intensity as New York, while New Jersey has only a slightly higher intensity. (We exclude U.S. territories from our calculations for both the Second District and the U.S. given the lack of available data for this exercise.) Therefore, the Second District has a much smaller carbon footprint relative to the size of its economy than the U.S. as a whole.
The Second District Trails the Country in Carbon Intensity
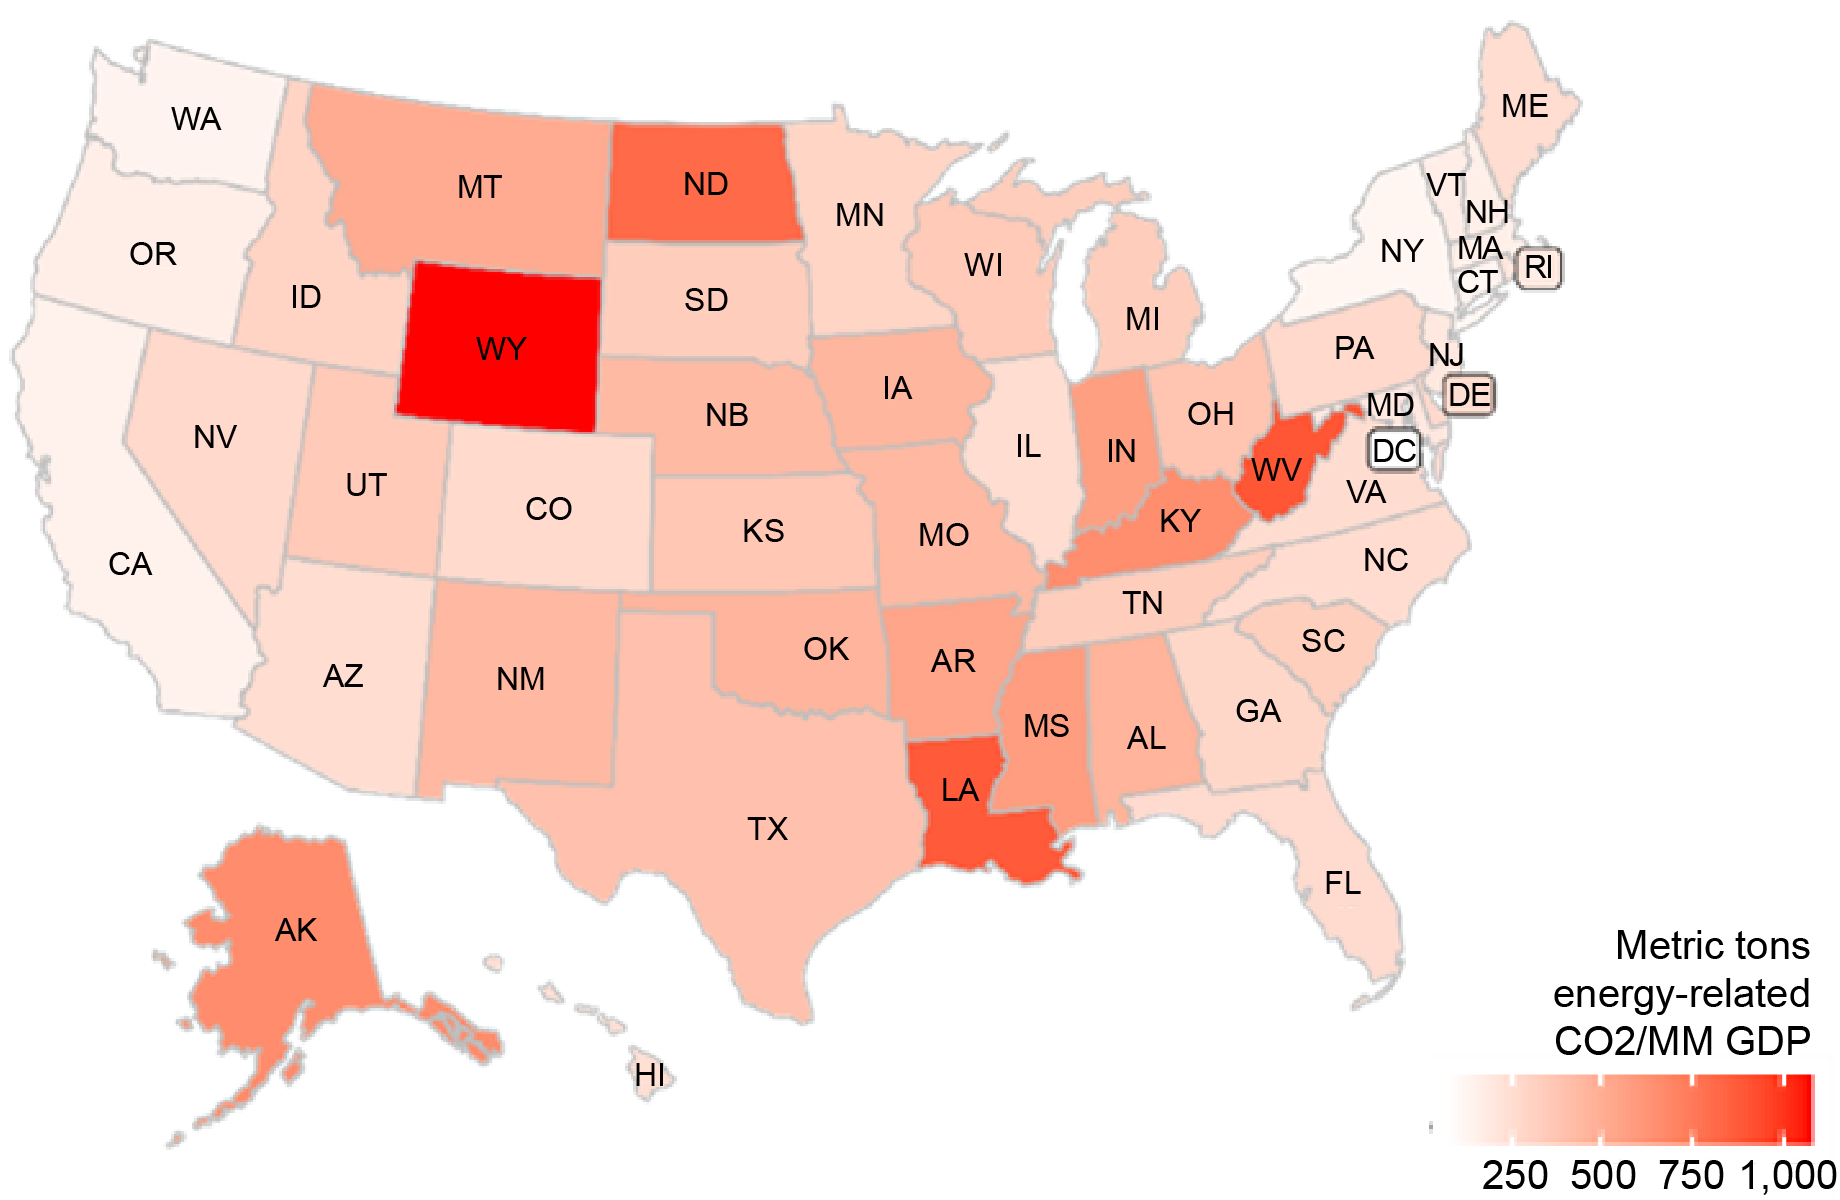
Source: U.S. Energy Information Administration (EIA).
Note: The map depicts the amount of CO2 required to produce $1 million of GDP, by state.
While New York State imports some of its electrical energy, much of its locally generated power and the power it imports from Canada is produced with renewable resources. According to a recent report by the New York State Research and Development Authority (NYSERDA), the predominant method of power generation in the state is hydroelectric, with nuclear making up almost the entire remaining energy production. This implies that New York State’s power generation may need fewer investments than that of other states to facilitate the transition. As can be taken from the map below, parts of the Midwest and the Great Plains states are much more heavily dependent on CO2-emitting power generation.
Second District Power Is Not Very Carbon Dependent
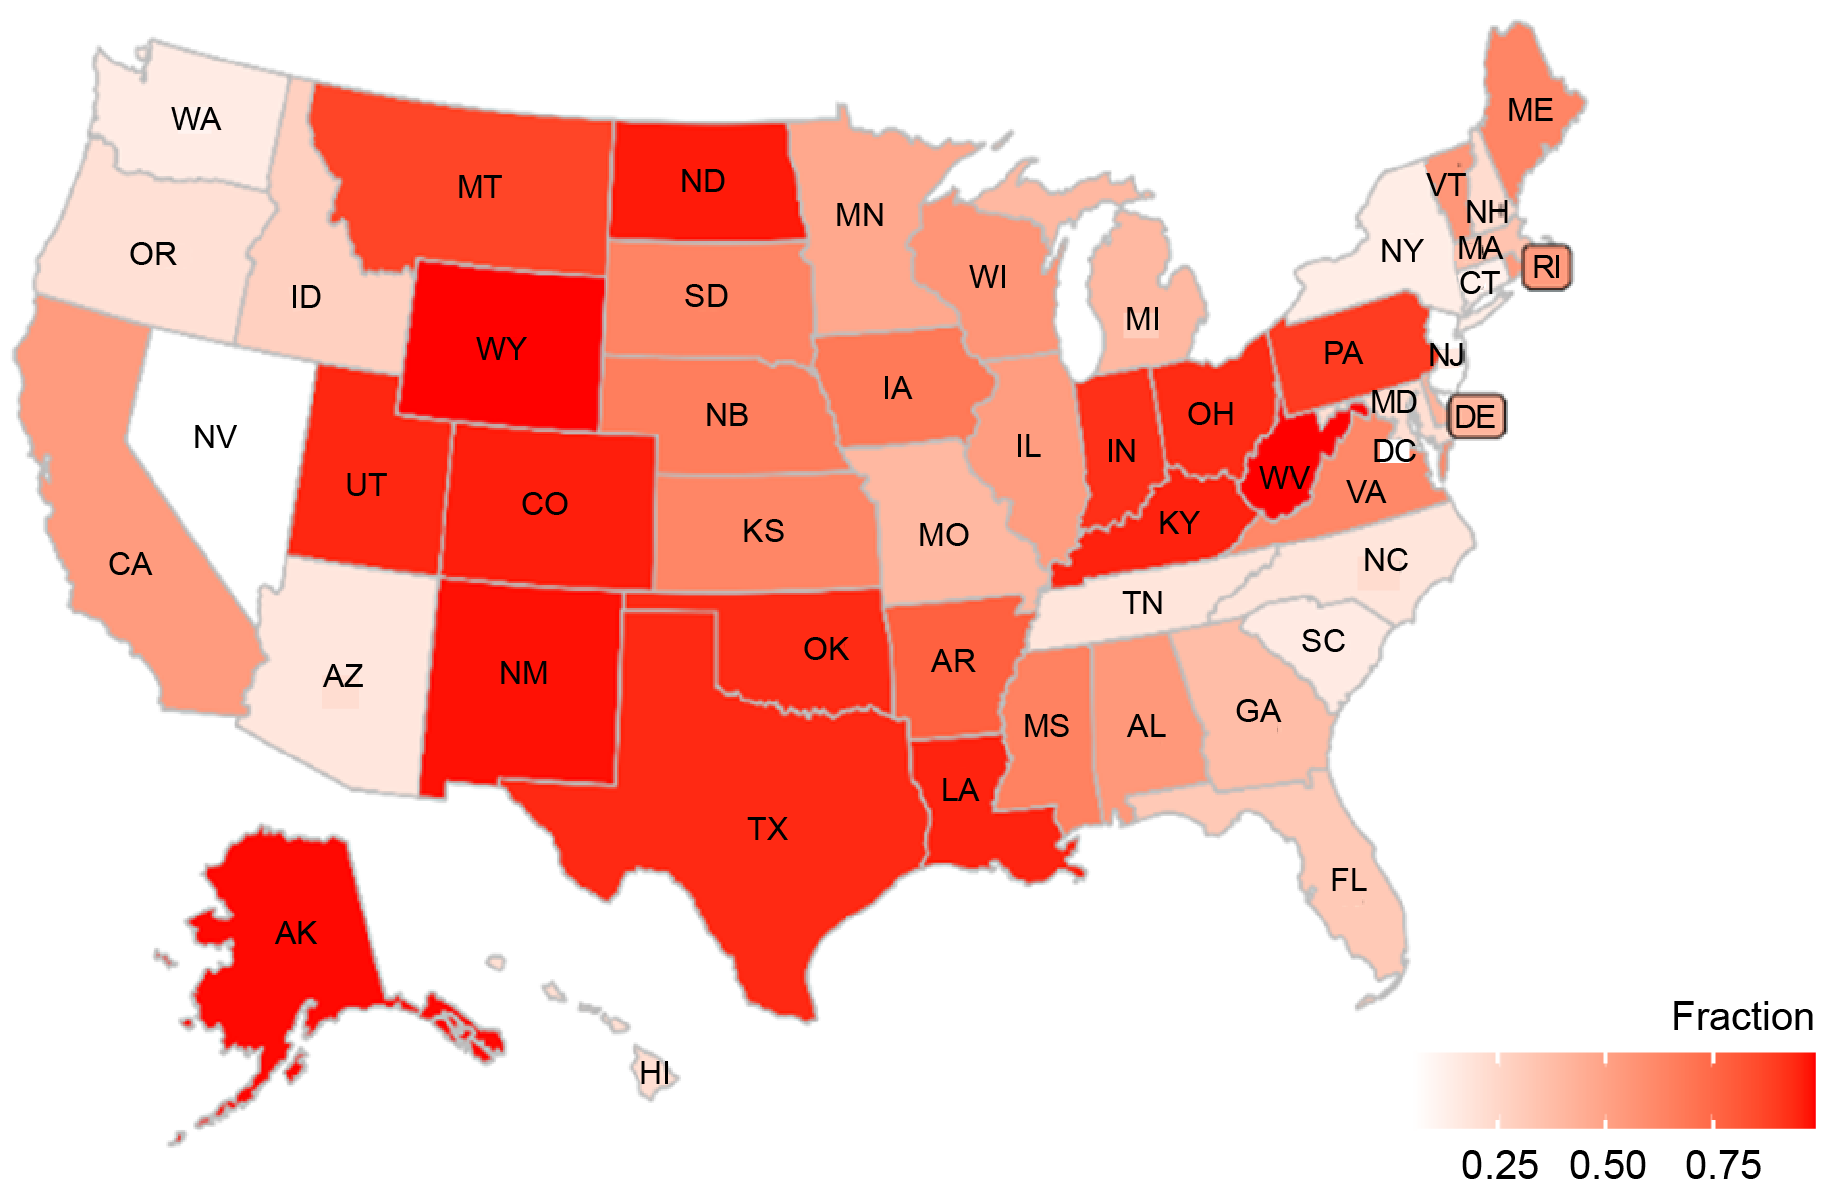
Source: Calculations by Board of Governors and Federal Reserve Bank of New York staff.
Note: The map shows the carbon intensity of the power generation of U.S. states on a scale from 0 to 1.
We can also look at the distribution of transition risks within the Second District. While data on CO2 emissions by county are not produced, we can use another metric: the fraction of the workforce in each county who are employed in the energy-intensive sectors of mining, quarrying, extraction, and utilities, obtained from the Quarterly Census of Employment and Wages (QCEW). Within the U.S., the states comprising the Second District have some of the lowest fractions of workers employed in these sectors. The map below shows that this fraction is essentially zero in New York City, most of the Hudson Valley, large parts of central New York and New Jersey, and in Fairfield County, Connecticut. Some counties in northern New York State and along the state’s border with Pennsylvania have some employment in these sectors, but it is generally less than 1.5 percent of these counties’ workforce. Only four counties in the Second District have a greater fraction of their workforce in the energy-intensive occupations, the most reliant county having 5.3 percent of its workforce in that sector.
Small Share of Second District Workforce Is Employed in Carbon-Intense Industries
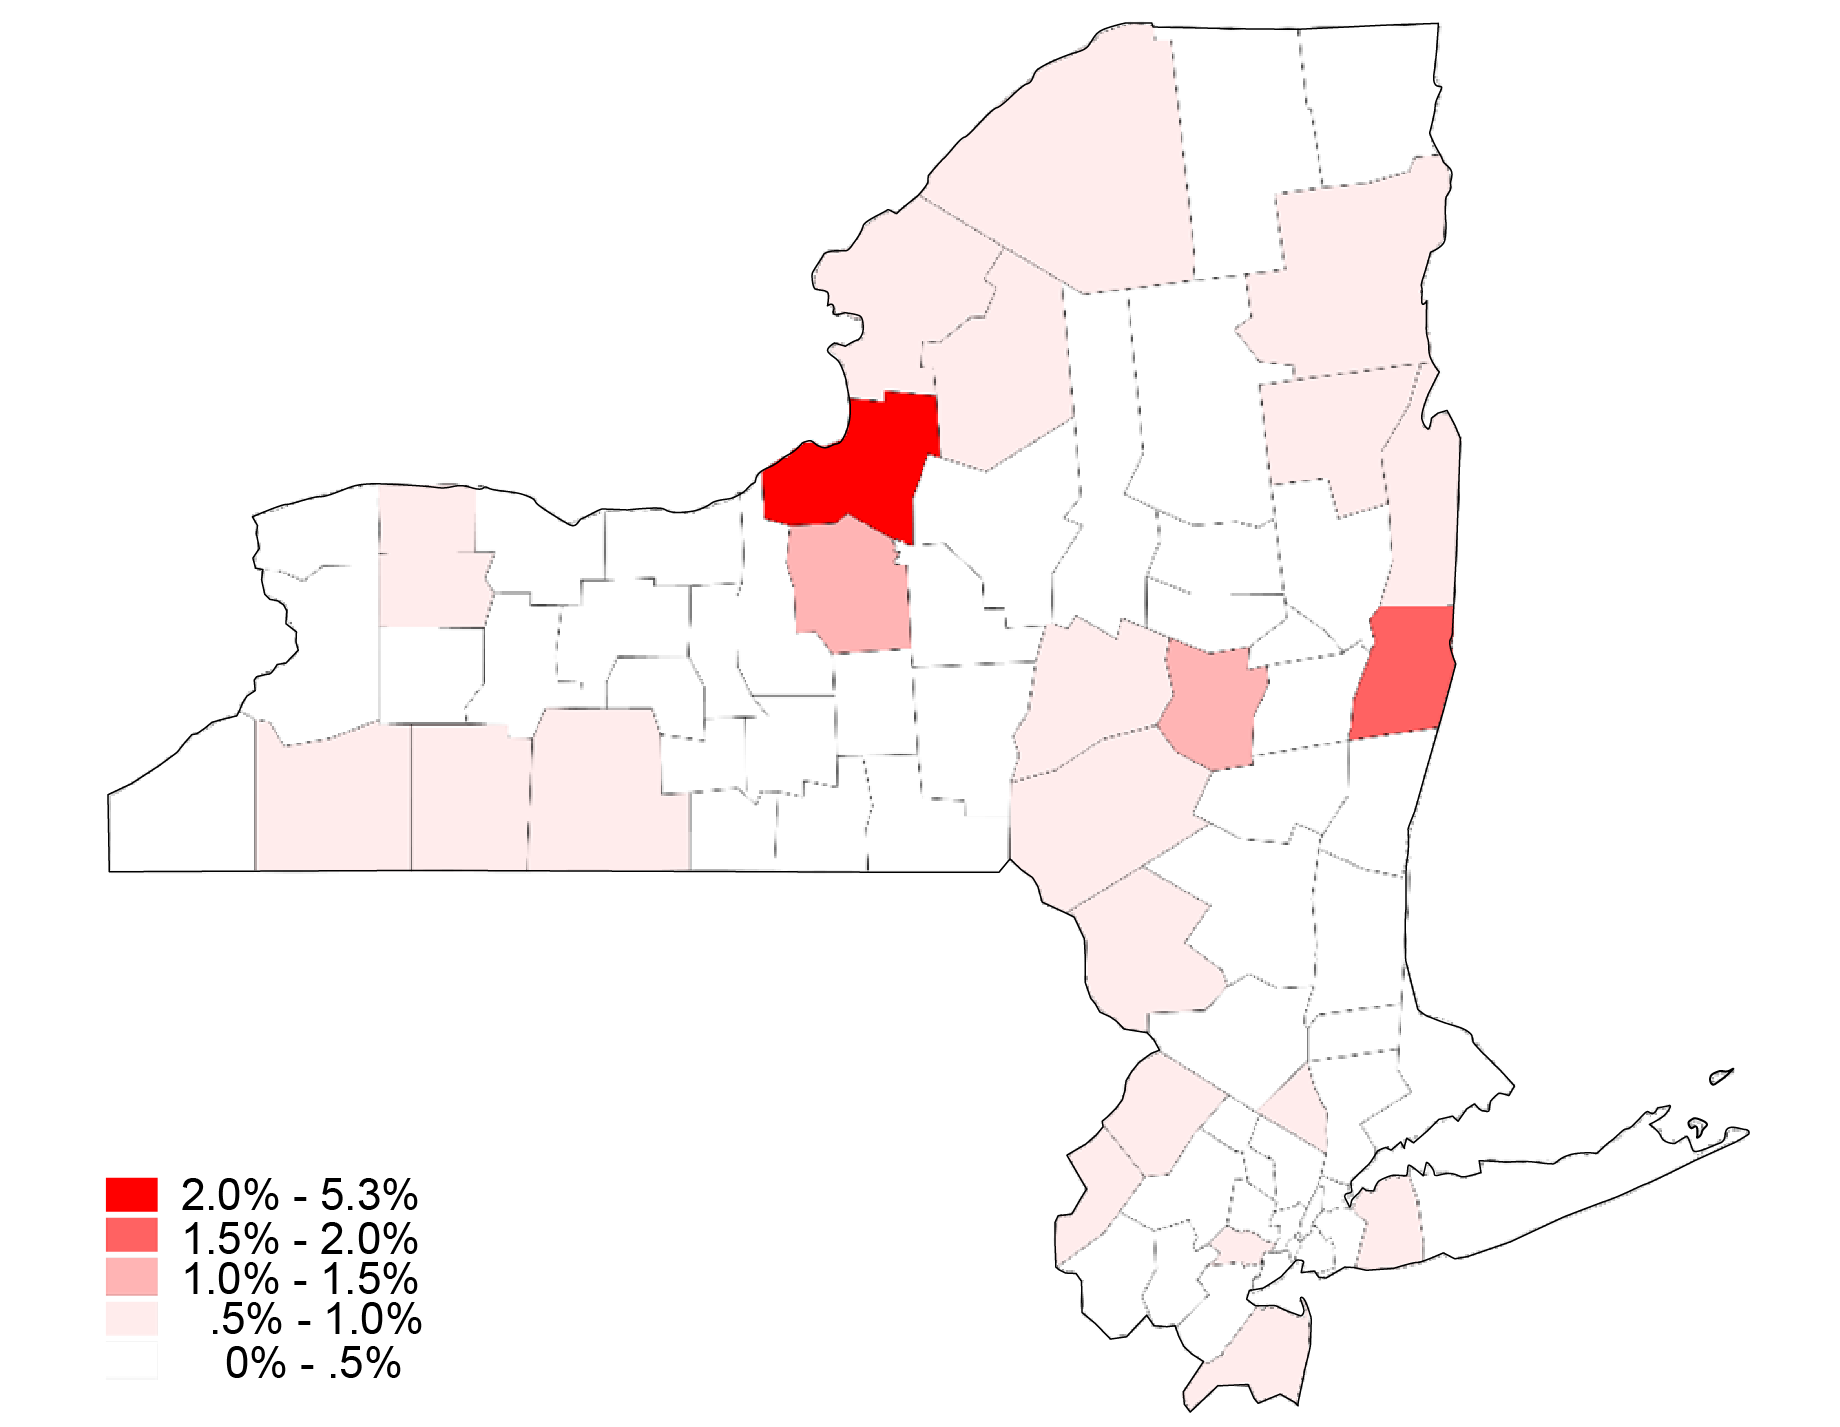
Source: Quarterly Census of Employment and Wages (QCEW).
Note: The map shows the share of each county’s workforce employed in sectors such as mining, quarrying, extraction, and utilities.
While the Second District is less reliant on carbon than the nation as a whole, decreasing carbon’s role in the District’s economy may be expensive. A substantial component of this effort will involve retrofitting buildings to be more energy efficient and to release less greenhouse gases, a task that may be particularly complicated in dense urban areas such as New York City. According to a recent New York Fed white paper, building upgrades will cost New York State one-third of a percent of GDP per year over thirty years; while small, this figure still represents a large fraction of the state budget, and much of these funds will likely be provided by the state government. Based on the carbon intensity of the Second District’s energy production and the degree to which the District relies on carbon to generate GDP, the direct costs associated with transition are likely to be lower for the District than for other regions of the country. However, given the complexity of climate-proofing dense urban areas such as New York City, the District’s specific transition plans may entail costs that exceed estimates based solely on its carbon intensity.
Concluding Remarks
The Second District’s exposure to carbon-intense GDP generation—and therefore its likely exposure to transition risk—is relatively low. This holds especially when compared to that of energy-intense states in the Midwest. However, making older and dense urban areas climate-proof could still entail significant costs that the states of the Second District may have to bear. Both this post and our earlier post on physical risk point to the regional heterogeneity in risk exposure across the United States. Measuring such risks accurately, however, may be difficult, particularly if a more granular geographical focus is employed. The next post in this series highlights this issue by looking at inaccuracies in flood risk maps in the Second District.

Kristian Blickle is a financial research economist in Climate Risk Studies in the Federal Reserve Bank of New York’s Research and Statistics Group.

Rajashri Chakrabarti is the head of Equitable Growth Studies in the Federal Reserve Bank of New York’s Research and Statistics Group.

Maxim Pinkovskiy is an economic research advisor in Equitable Growth Studies in the Federal Reserve Bank of New York’s Research and Statistics Group.
How to cite this post:
Kristian Blickle, Rajashri Chakrabarti, and Maxim Pinkovskiy, “Transition Risks in the Fed’s Second District and the Nation,” Federal Reserve Bank of New York Liberty Street Economics, November 9, 2023, https://libertystreeteconomics.newyorkfed.org/2023/11/transition-risks-i....
Comparing Physical Risk: The Fed’s Second District versus the Nation
Disclaimer
The views expressed in this post are those of the author(s) and do not necessarily reflect the position of the Federal Reserve Bank of New York or the Federal Reserve System. Any errors or omissions are the responsibility of the author(s).
To Tackle Inequality, We Need to Start Talking About Where Wealth Comes From
Thatcherite narrative on wealth creation has gone unchallenged for decades.
The post To Tackle Inequality, We Need to Start Talking About Where Wealth Comes From appeared first on Evonomics.