banks
Bond Funds in the Aftermath of SVB’s Collapse

March 2023 will rightfully be remembered as a period of major turmoil for the U.S. banking industry. In this post, we go beyond banks to analyze how fixed-income, open-end funds (bond funds) fared in the days after the start of the banking crisis. We find that bond funds experienced net outflows each day for almost three weeks after the run on Silicon Valley Bank (SVB), and that these outflows were experienced diffusely across the entire segment. Our preliminary evidence suggests that the outflows from bond funds may have been an unintended consequence of the exceptional measures taken to strengthen the balance sheet of banks during this time.
Bond Funds during the Bank Run of March 2023
The events of March 10, starting with the run on SVB’s deposits and ending with SVB’s failure and takeover by the FDIC, led to widespread turmoil in the banking industry. In response to the crisis, authorities acted swiftly by establishing the Bank Term Funding Program (BTFP) on Sunday, March 12, a measure that was designed to stave off further runs by bank depositors.
While much has been written about how banks weathered the crisis, here we assess how nonbanks were affected by the same events, focusing on the fast-growing segment of open-end bond funds. These vehicles offer agents the opportunity to invest in fixed-income instruments, such as corporate or government bonds, and a variety of more specialized instruments (for example, agency securities). Since investors can redeem their investments on demand, if the funds were to experience a wave of redemptions, they may need to sell a portion of their assets. But because bond funds invest in instruments of varying degrees of liquidity, these potential asset sales may lead to an overall loss in the value of their remaining balances. This institutional feature of open-end bond funds leaves them exposed to liquidity risk, similar in nature to the run risk faced by banking institutions (see, for instance, research by Chen et al. and Goldstein et al., as well as policy statements from the Financial Stability Board and the SEC).
The establishment of the BTFP may have led to unintended consequences for investors in bond funds. In particular, bank deposits suddenly became comparatively safer on Monday, March 13, after the facility started to function. Consequently, the value of the liquidity services provided by holdings in bond funds might have diminished relative to those provided by bank deposits, given the similarity between these two liquidity instruments. As markets resumed operation, fund investors may have had an additional incentive to redeem, thus, according to this conjecture, contributing to abnormally persistent outflows from the bond funds.
Did Bond Fund Outflows Increase after the Run on SVB?
Using daily flow data from Morningstar, we find that fixed income funds experienced persistent outflows every day after the weekend of SVB’s failure and continued for fourteen consecutive business days. In the chart below, we report net flows for a longer time series, to show that while aggregate outflows happen routinely in this industry, they are typically reversed quickly in the following days.
Fixed Income Funds Net Flows, Feb-Apr 2023
Billions of dollars
{"padding":{"auto":false,"left":21},"color":{"pattern":["#046C9D","#D0993C","#9FA1A8","#656D76","#8FC3EA","#0D96D4","#B1812C"]},"interaction":{"enabled":true},"point":{"show":false},"data":{"groups":[],"labels":false,"type":"bar","order":"desc","selection":{"enabled":false,"grouped":true,"multiple":true,"draggable":true},"xFormat":"%m\/%d\/%Y","rows":[["Fixed Income Funds Net Flows"],["0.232258295"],["0.485005782"],["-0.370923645"],["0.762557239"],["0.122597749"],["-0.80180507"],["-0.574106533"],["-2.262990212"],["-0.43196335"],["-0.96882662"],["0.270362469"],["0.995570249"],["2.753409916"],["-0.654224138"],["-1.070781363"],["-0.028582859"],["-0.353868991"],["-0.272207643"],["-0.338706312"],["-1.035297242"],["-1.005657637"],["-1.739206435"],["-0.977118513"],["-1.854192253"],["-1.174505085"],["-0.359198531"],["-1.243409771"],["-0.576981038"],["-0.81882407"],["-0.647024059"],["-1.400607978"],["-0.691853219"],["-1.238057974"],["-0.760316432"],["1.398053839"],["4.358453309"],["0.244156376"],["0.20716379"],["-0.945781213"],["0.009792186"]]},"legend":{"show":true,"position":"bottom"},"tooltip":{"show":true,"grouped":true},"axis":{"rotated":false,"x":{"show":true,"type":"category","localtime":true,"tick":{"centered":false,"culling":{"max":"7"},"fit":true,"outer":true,"multiline":false,"multilineMax":0},"label":{"text":"","position":"outer-center"},"categories":["Feb 10","Feb 13","Feb 14","Feb 15","Feb 16","Feb 17","Feb 21","Feb 22","Feb 23","Feb 24","Feb 27","Feb 28","Mar 01","Mar 02","Mar 03","Mar 06","Mar 07","Mar 08","Mar 09","Mar 10","Mar 13","Mar 14","Mar 15","Mar 16","Mar 17","Mar 20","Mar 21","Mar 22","Mar 23","Mar 24","Mar 27","Mar 28","Mar 29","Mar 30","Mar 31","Apr 03","Apr 04","Apr 05","Apr 06","Apr 10"]},"y":{"show":true,"inner":false,"type":"linear","inverted":false,"tick":{"centered":false,"culling":false},"padding":{"top":3,"bottom":0},"primary":"","secondary":"","label":{"text":"","position":"outer-middle"},"max":5,"min":-3},"y2":{"show":false,"inner":false,"type":"linear","inverted":false,"padding":{"top":3},"label":{"text":"","position":"outer-middle"}}},"grid":{"x":{"show":false,"lines":[],"type":"indexed","stroke":""},"y":{"show":true,"lines":[],"type":"linear","stroke":""}},"regions":[],"chartLabel":"Billions of dollars","trend":{"show":false,"label":"Trend"},"zoom":false,"subchart":false,"download":true,"downloadText":"Download chart","downloadName":"chart"}
Sources: Morningstar Direct; authors’ calculations.
However, outflows persisting for almost three weeks is quite unusual. Using daily data from January 2018 to July 10, 2023, we count instances of outflows that persisted for consecutive days. The chart below shows that outflows typically persist up to three days, with anything longer occurring rarely.
Fixed Income Outflow Episodes by Duration
Days
{"padding":{"auto":false,"left":23},"color":{"pattern":["#046C9D","#D0993C","#9FA1A8","#656D76","#8FC3EA","#0D96D4","#B1812C"]},"interaction":{"enabled":true},"point":{"show":false},"data":{"groups":[],"labels":false,"type":"bar","order":"desc","selection":{"enabled":false,"grouped":true,"multiple":true,"draggable":true},"x":"","rows":[["Run Length (Days)"],["68"],["16"],["10"],["5"],["4"],["2"],["4"],["1"],["3"],["0"],["2"],["1"],["0"],["1"],["0"],["1"],["0"],["1"],["3"],["3"],["2"],["1"]]},"legend":{"show":true,"position":"bottom"},"tooltip":{"show":true,"grouped":true},"axis":{"rotated":false,"x":{"show":true,"type":"category","localtime":true,"tick":{"centered":false,"culling":false,"fit":true,"outer":true,"multiline":false,"multilineMax":0},"label":{"text":"","position":"outer-center"},"categories":["1","2","3","4","5","6","7","8","9","10","11","12","13","14","15","16","17","18","19","20","21","22"]},"y":{"show":true,"inner":false,"type":"linear","inverted":false,"tick":{"centered":false,"culling":false},"padding":{"top":3,"bottom":0},"primary":"","secondary":"","label":{"text":"","position":"outer-middle"},"max":70,"min":0},"y2":{"show":false,"inner":false,"type":"linear","inverted":false,"padding":{"top":3},"label":{"text":"","position":"outer-middle"}}},"grid":{"x":{"show":false,"lines":[],"type":"indexed","stroke":""},"y":{"show":true,"lines":[],"type":"linear","stroke":""}},"regions":[],"chartLabel":"Days","trend":{"show":false,"label":"Trend"},"zoom":false,"subchart":false,"download":true,"downloadText":"Download chart","downloadName":"chart"}
Sources: Morningstar Direct; authors’ calculations.
This spell of outflows was not just driven by a handful of very large funds, which were perhaps heavily exposed to the affected banks or held similar asset portfolios to those of the affected banks. Instead, the outflows affected a wide cross-section of bond funds: indeed, out of 1,587 fixed income funds in our dataset between March 13 and March 30, 2023, 1,128 (or about 71 percent) experienced cumulative net outflows.
Could these persistent bond fund outflows be driven not by the bank run but instead by a broad, economy-wide reaction to the banking crisis that pushed investors in investment funds to change their asset allocation? To address this alternative explanation, we compare the net flows of corporate bond funds and equity funds, since research studies have empirically documented that the “run-like” behavior typically associated with bond funds, and especially the corporate bond segment, is not found in equity funds. If fund investors withdrew in response to an economy-wide increase in risk and uncertainty after March 10, then we should observe a similar pattern of net outflows for both corporate bond and equity funds. However, if at least part of the post-SVB dynamics is driven by investors’ re-assessment of the run risk of their fund holdings, then we should observe differentially stronger outflows from corporate bond funds.
The chart below shows that equity and corporate bond funds exhibit a very similar pattern prior to the run on SVB. After the run, corporate bond funds did experience cumulatively more severe outflows, a pattern consistent with the greater perceived safety of bank deposits relative to bond holdings after the initiation of the BTFP.
Cumulative Net Flow as Share of Assets Under Management
Percent
{"padding":{"auto":true},"color":{"pattern":["#61AEE1","#B84645","#B1812C","#046C9D","#9FA1A8","#DCB56E"]},"interaction":{"enabled":true},"point":{"show":false},"data":{"groups":[],"labels":false,"type":"line","order":"desc","selection":{"enabled":false,"grouped":true,"multiple":true,"draggable":true},"x":"Date","xFormat":"%m\/%d\/%Y","rows":[["Date","Equity","Total Corporate Bond"],["2\/16\/2023","-0.0144953","0.0038122"],["2\/17\/2023","-0.0274374","-0.0401246"],["2\/21\/2023","-0.0303448","-0.0579263"],["2\/22\/2023","-0.0413214","-0.1578171"],["2\/23\/2023","-0.0591036","-0.1722821"],["2\/24\/2023","-0.0815646","-0.2385408"],["2\/27\/2023","-0.0949653","-0.2285217"],["2\/28\/2023","-0.0598834","-0.1041755"],["3\/1\/2023","-0.1511636","-0.0694298"],["3\/2\/2023","-0.1658848","-0.0948866"],["3\/3\/2023","-0.1790695","-0.1401305"],["3\/6\/2023","-0.197092","-0.1489497"],["3\/7\/2023","-0.268441","-0.1717982"],["3\/8\/2023","-0.2342276","-0.1793094"],["3\/9\/2023","-0.2530376","-0.1966312"],["3\/10\/2023","-0.2714795","-0.2333652"],["3\/13\/2023","-0.2815696","-0.2825896"],["3\/14\/2023","-0.2970467","-0.3826536"],["3\/15\/2023","-0.3452581","-0.3991919"],["3\/16\/2023","-0.3096336","-0.4981698"],["3\/17\/2023","-0.3310225","-0.5494384"],["3\/20\/2023","-0.3477069","-0.5800354"],["3\/21\/2023","-0.3601978","-0.6302427"],["3\/22\/2023","-0.3888854","-0.651972"],["3\/23\/2023","-0.4162634","-0.6888902"],["3\/24\/2023","-0.4347197","-0.7240298"],["3\/27\/2023","-0.4657265","-0.7905014"],["3\/28\/2023","-0.4896366","-0.8273016"],["3\/29\/2023","-0.5149255","-0.8916021"],["3\/30\/2023","-0.5366368","-0.9133132"]]},"legend":{"show":true,"position":"bottom"},"tooltip":{"show":true,"grouped":true},"axis":{"rotated":false,"x":{"show":true,"type":"timeseries","localtime":true,"tick":{"centered":false,"culling":{"max":"0"},"fit":true,"outer":true,"multiline":false,"multilineMax":0,"format":"%b %e","values":["02\/16\/2023","03\/13\/2023","03\/27\/2023","02\/27\/2023","02\/21\/2023","03\/06\/2023","03\/20\/2023"]},"label":{"text":"","position":"outer-center"},"format":"%Y-%m-%d"},"y":{"show":true,"inner":false,"type":"linear","inverted":false,"tick":{"centered":false,"culling":false,"values":["0.2","0","-0.2","-0.4","-0.6","-0.8","-1"]},"padding":{"top":3,"bottom":0},"primary":"","secondary":"","label":{"text":"","position":"outer-middle"},"max":0.2,"min":-1},"y2":{"show":false,"inner":false,"type":"linear","inverted":false,"padding":{"top":3},"label":{"text":"","position":"outer-middle"}}},"grid":{"x":{"show":false,"lines":[{"value":"3\/13\/2023","text":"","position":""}],"type":"indexed","stroke":"dashed"},"y":{"show":true,"lines":[],"type":"linear","stroke":""}},"regions":[],"chartLabel":"Percent","trend":{"show":false,"label":"Trend"},"zoom":false,"subchart":false,"download":true,"downloadText":"Download chart","downloadName":"chart"}
Sources: Morningstar Direct; authors’ calculations.
The Effect of Interest Rates on Bond Fund Holdings
The banking crisis, and the subsequent government intervention, occurred during a period of rising interest rates (and in fact the bank deterioration itself was in large part driven by rising rates). The crisis led to a downward revision of market expectations regarding the path of interest rates. And because lower interest rates benefit fixed-income instruments, the negative impact on flows in bond funds might have been even stronger in the absence of this interest rate channel. We thus repeat the previous exercise, this time comparing outflows within the corporate bond funds segment, but between funds with differential exposures to interest rates. To do so, we consider the net flow trends of long and intermediate term, investment grade corporate bond funds, versus those of ultrashort and short term, investment grade corporate bond funds. The funds with the longer maturity structure should be more exposed to interest rate changes, so these funds should experience relatively less severe outflows than the funds with a very short maturity structure, if investors expect lower rates after the crisis. The differential effect should be a measure of the perceived higher run risk post BTFP. As expected, the chart below shows that, while both short-maturity and long-maturity funds experience increasing outflows since March 1, the shortest maturity funds experience a relatively greater acceleration in outflows after March 13.
Cumulative Net Flow as Share of Assets Under Management
Percent
{"padding":{"auto":false,"left":38,"right":53},"color":{"pattern":["#61AEE1","#B84645","#B1812C","#046C9D","#9FA1A8","#DCB56E"]},"interaction":{"enabled":true},"point":{"show":false},"data":{"groups":[],"labels":false,"type":"line","order":"desc","selection":{"enabled":false,"grouped":true,"multiple":true,"draggable":true},"x":"Date","xFormat":"%m\/%d\/%Y","rows":[["Date","Long","Short"],["3\/1\/2023","0.00177295","0.000257796"],["3\/2\/2023","0.001888273","-0.001684988"],["3\/3\/2023","0.001757161","-0.003842665"],["3\/6\/2023","0.00173894","-0.003917512"],["3\/7\/2023","0.001302232","-0.004770373"],["3\/8\/2023","0.001326877","-0.006297555"],["3\/9\/2023","0.001531805","-0.007300324"],["3\/10\/2023","0.001109367","-0.008439074"],["3\/13\/2023","0.000498332","-0.009255057"],["3\/14\/2023","0.000457948","-0.012340567"],["3\/15\/2023","3.00E-05","-0.013578792"],["3\/16\/2023","-0.000284552","-0.015480014"],["3\/17\/2023","-0.000733251","-0.016262504"],["3\/20\/2023","-0.00069634","-0.015819729"],["3\/21\/2023","-0.000539762","-0.016282707"],["3\/22\/2023","-0.000703912","-0.017665838"],["3\/23\/2023","-0.000734801","-0.018294432"],["3\/24\/2023","-0.000873453","-0.019188643"],["3\/27\/2023","-0.001525331","-0.019339116"],["3\/28\/2023","-0.001502524","-0.021219434"],["3\/29\/2023","-0.001843724","-0.023988249"],["3\/30\/2023","-0.002150862","-0.025158165"],["3\/31\/2023","-0.001964636","-0.025385647"]]},"legend":{"show":true,"position":"bottom"},"tooltip":{"show":true,"grouped":true},"axis":{"rotated":false,"x":{"show":true,"type":"timeseries","localtime":true,"tick":{"centered":false,"culling":{"max":"0"},"fit":true,"outer":true,"multiline":false,"multilineMax":0,"format":"%b %e","rotate":0,"values":["3\/1\/2023","3\/7\/2023","3\/13\/2023","3\/20\/2023","3\/27\/2023"]},"label":{"text":"","position":"outer-center"},"format":"%Y-%m-%d"},"y":{"show":true,"inner":false,"type":"linear","inverted":false,"tick":{"centered":false,"culling":false,"values":["0.05","0.03","0.01","-0.01","-0.03","0"]},"padding":{"top":3,"bottom":0},"primary":"","secondary":[],"label":{"text":"","position":"outer-middle"},"max":0.05,"min":-0.03},"y2":{"show":false,"inner":false,"type":"linear","inverted":false,"padding":{"top":3},"label":{"text":"","position":"outer-middle"}}},"grid":{"x":{"show":false,"lines":[{"value":"03\/13\/2023","text":"","position":""}],"type":"indexed","stroke":"dashed"},"y":{"show":true,"lines":[],"type":"linear","stroke":""}},"regions":[{"axis":"x","start":"","end":10,"class":""}],"chartLabel":"Percent","trend":{"show":false,"label":"03\/10\/2023"},"zoom":false,"subchart":false,"download":true,"downloadText":"Download chart","downloadName":"chart"}
Sources: Morningstar Direct; authors’ calculations.
Note: Series display cumulative net flows for short- and long-maturity funds.
To better quantify the effect, in the table below we compare the cumulative net flows as a percentage of assets under management (AUM) experienced by the two categories of funds in the days prior to March 10 (“Before”), and the days starting on March 13 (“After”). The “Delta” row shows the difference (After – Before), with the isolated number in the last column representing the difference in the differences (i.e., Delta Short – Delta Long). Hence, the hypothesized effect associated with the introduction of the BTFP is responsible for extra outflows in the order of about 0.5 percent of total AUM.
Cumulative Net Flows by Fund Type, Before and After SVB’s Collapse
Long FundsShort FundsBefore0.15%-0.73%After-0.31%-1.69%Delta-0.46%-0.96%-0.50%Sources: Morningstar Direct; authors’ calculations.
Was the outflow from bond funds after the failure of SVB severe enough to raise potential financial stability concerns? Probably not. In aggregate, the net bond fund outflow was about $15 billion, which is a tiny fraction of the overall bond fund market. However, even if minor in absolute terms, small-scale asset sales could still be sufficient to dislocate prices in illiquid markets, giving rise to potential channels of shock amplification. This is an issue for future research.
Final Words
Our analysis highlights how financial intermediation activities seem quite closely intertwined. Thus, banks and nonbank financial institutions should not be seen as separate “domains.” Accordingly, supervisors and regulators may wish to take a more integrated approach to monitoring and regulating financial intermediation activities—one that considers both direct effects and indirect consequences of shocks across a range of institution types.

Nicola Cetorelli is the head of Non-Bank Financial Institution Studies in the Federal Reserve Bank of New York’s Research and Statistics Group.

Sarah Zebar is a research analyst in the Federal Reserve Bank of New York’s Research and Statistics Group.
How to cite this post:
Nicola Cetorelli and Sarah Zebar, “Bond Funds in the Aftermath of SVB’s Collapse,” Federal Reserve Bank of New York Liberty Street Economics, November 28, 2023, https://libertystreeteconomics.newyorkfed.org/2023/11/bond-funds-in-the-....


The Bond Market Selloff in Historical Perspective
Disclaimer
The views expressed in this post are those of the author(s) and do not necessarily reflect the position of the Federal Reserve Bank of New York or the Federal Reserve System. Any errors or omissions are the responsibility of the author(s).
The Nonbank Shadow of Banks
Financial and technological innovation and changes in the macroeconomic environment have led to the growth of nonbank financial institutions (NBFIs), and to the possible displacement of banks in the provision of traditional financial intermediation services (deposit taking, loan making, and facilitation of payments). In this post, we look at the joint evolution of banks—referred to as depository institutions from here on—and nonbanks inside the organizational structure of bank holding companies (BHCs). Using a unique database of the organizational structure of all BHCs ever in existence since the 1970s, we document the evolution of NBFI activities within BHCs. Our evidence suggests that there exist important conglomeration synergies to having both banks and NBFIs under the same organizational umbrella.
The Evolution of Banks and Nonbanks: Alternative Views
The traditional view of financial intermediation is that banks and nonbanks evolve independently. Banks are fundamentally depository institution that make loans and facilitate payments, and their evolution remains anchored on these “core” activities. NBFIs, on the other hand, are seen as a heterogenous bunch—insurers, specialty lenders, investment funds, et cetera, with each segment operating under distinct business models, governing structures, and even regulations. One commonality of NBFIs, however, is that they can substitute for banks as financial intermediaries.
An alternative view is that banks evolve and adapt their business model to the prevalent mode of financial intermediation. Under this view, the evolution of banks and nonbanks is highly intertwined. For example, financial innovation and regulatory changes in the 1990s enhanced asset securitization, shifting the prevalent mode of financial intermediation from a bank-centric model of taking deposits and issuing loans (and holding them to maturity) to a new model where loans were packaged into securities and sold to investors. With this shift, several nonbank activities involving the provision of specialized services in support of the securitization process (such as specialty lending, making markets, managing assets, and insurance) grew in importance. Rather than remaining passive observers of these trends, banks adapted their business models and increasingly incorporated these new activities under their organizational umbrellas to take advantage of synergistic benefits. This alternative view implies that banks and NBFI activities may be complementary to one another and not substitutes.
In this post, we provide ample support for that alternative view. Our unique database of the organizational structure of all BHCs allows us to track each subsidiary in the banking industry over the last fifty years, map the subsidiary to its direct parent and to its ultimate parent, and track the activity that the subsidiary is engaged in. Using this data, we describe the joint evolution of banks and nonbanks over the past thirty years.
The Co-Evolution of Banks and Nonbanks
BHCs have historically had a substantial nonbank footprint. In the chart below, we decompose the activities of BHCs’ subsidiaries. For each quarter from 1990 to 2022, we select the top 200 BHCs by assets (collectively holding approximately 90 percent of industry assets), excluding Goldman Sachs, Morgan Stanley, and other BHCs that only entered the industry later in the sample period. We find that BHCs have thousands of subsidiaries, the vast majority of which are nonbanks. Over the years, BHCs have added entities such as nonbank lenders, broker-dealers, asset management institutions (funds), and insurers, among others. As of 2022:Q4, only about 8 percent of BHC subsidiaries were classified as commercial banks (depository institutions).
Composition of BHC Subsidiaries by Activity
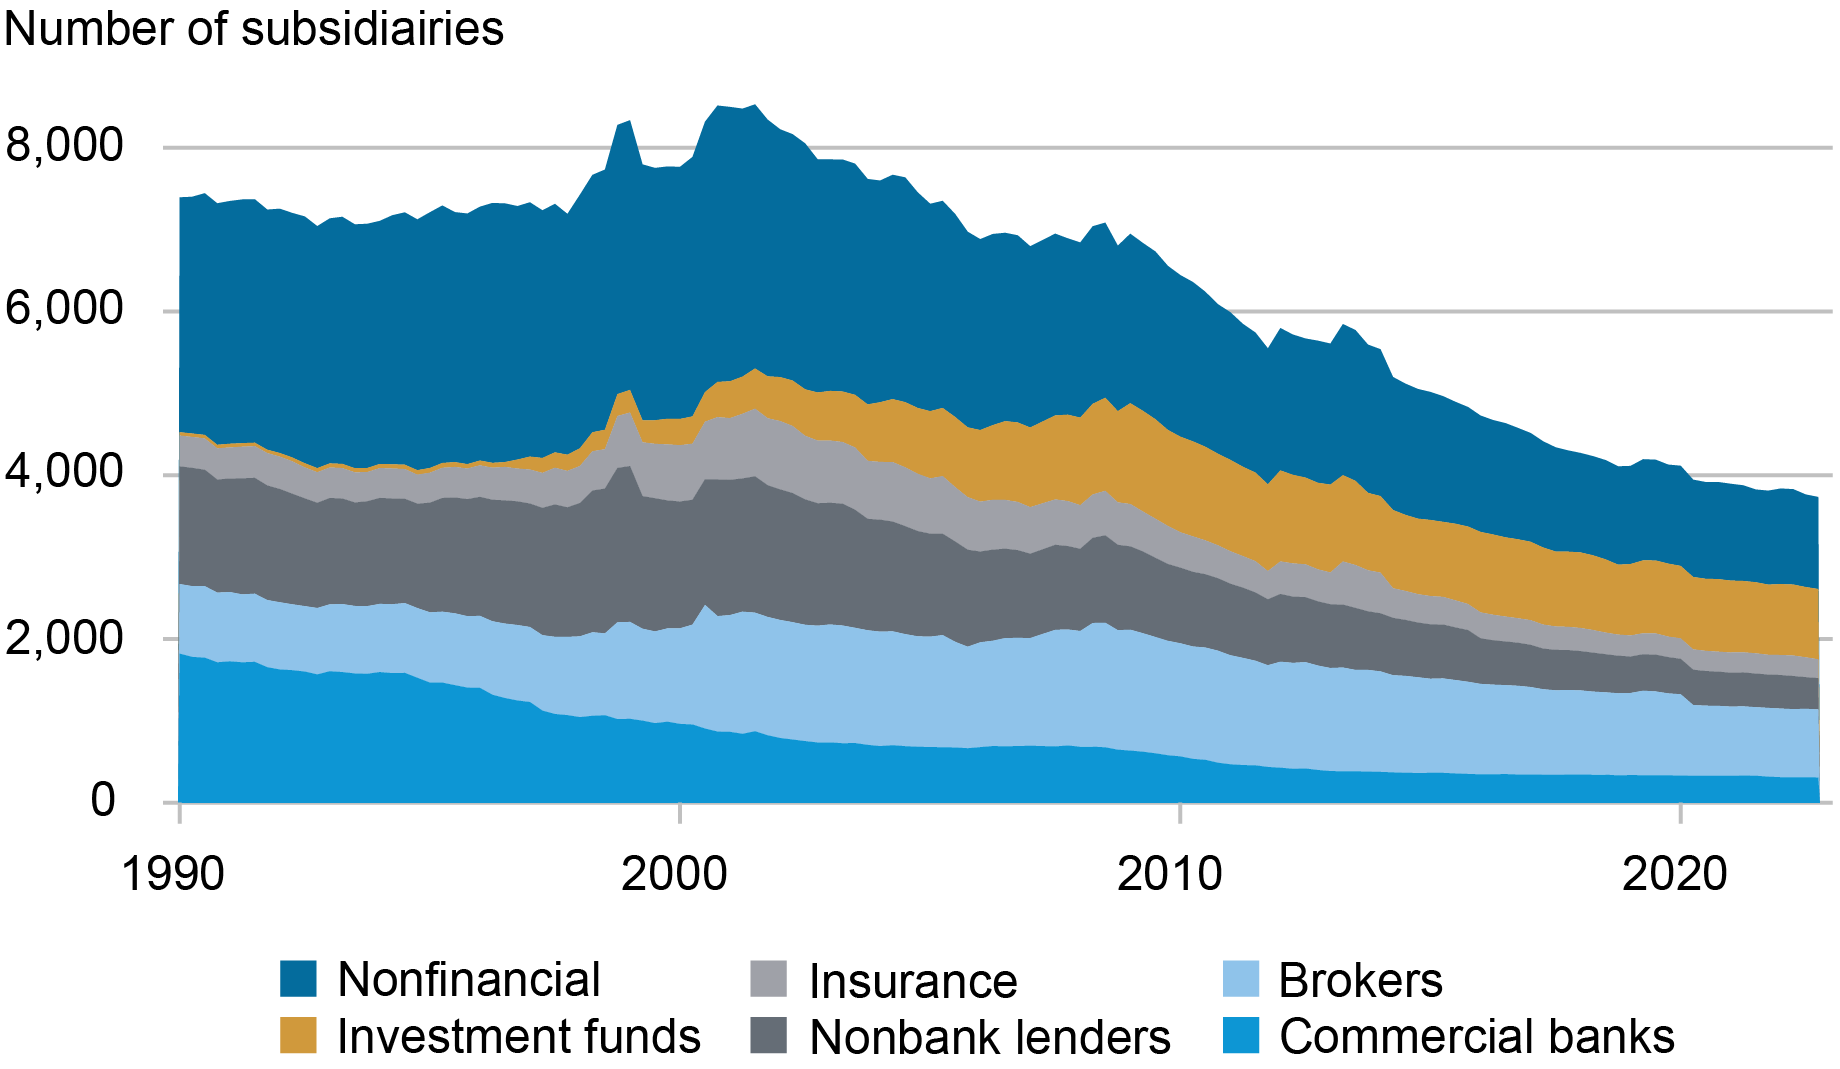
Sources: FR Y-10; authors’ calculations.
Note: We exclude the following BHCs: Goldman Sachs, Morgan Stanley, American Express, CIT Group, Ally Financial, Discover, M&T Bank, MetLife.
A view of nonbank activities centered on subsidiary counts may be misleading because those entities could just be empty shells created for legal reasons, or they could be incidental to the business, like the nonfinancial subsidiaries we observe in the chart above, but not necessarily reflecting activities the BHCs engage in. Instead, we find that nonbank subsidiaries are meaningful contributors to the business model of BHCs, as measured by the composition of their assets and income. In the chart below, we decompose the assets of the top 200 BHCs by subsidiary type: bank or nonbank. To do so, we take advantage of a lesser utilized reporting form, the FR Y-9LP, which captures the unconsolidated balance sheet of BHCs’ parent companies (or intermediate holding companies). As the chart shows, NBFIs account for a steadily increasing share of total BHC assets—about 15 percent, or more than $2.9 trillion, as of 2022:Q4.
Composition of BHC Assets
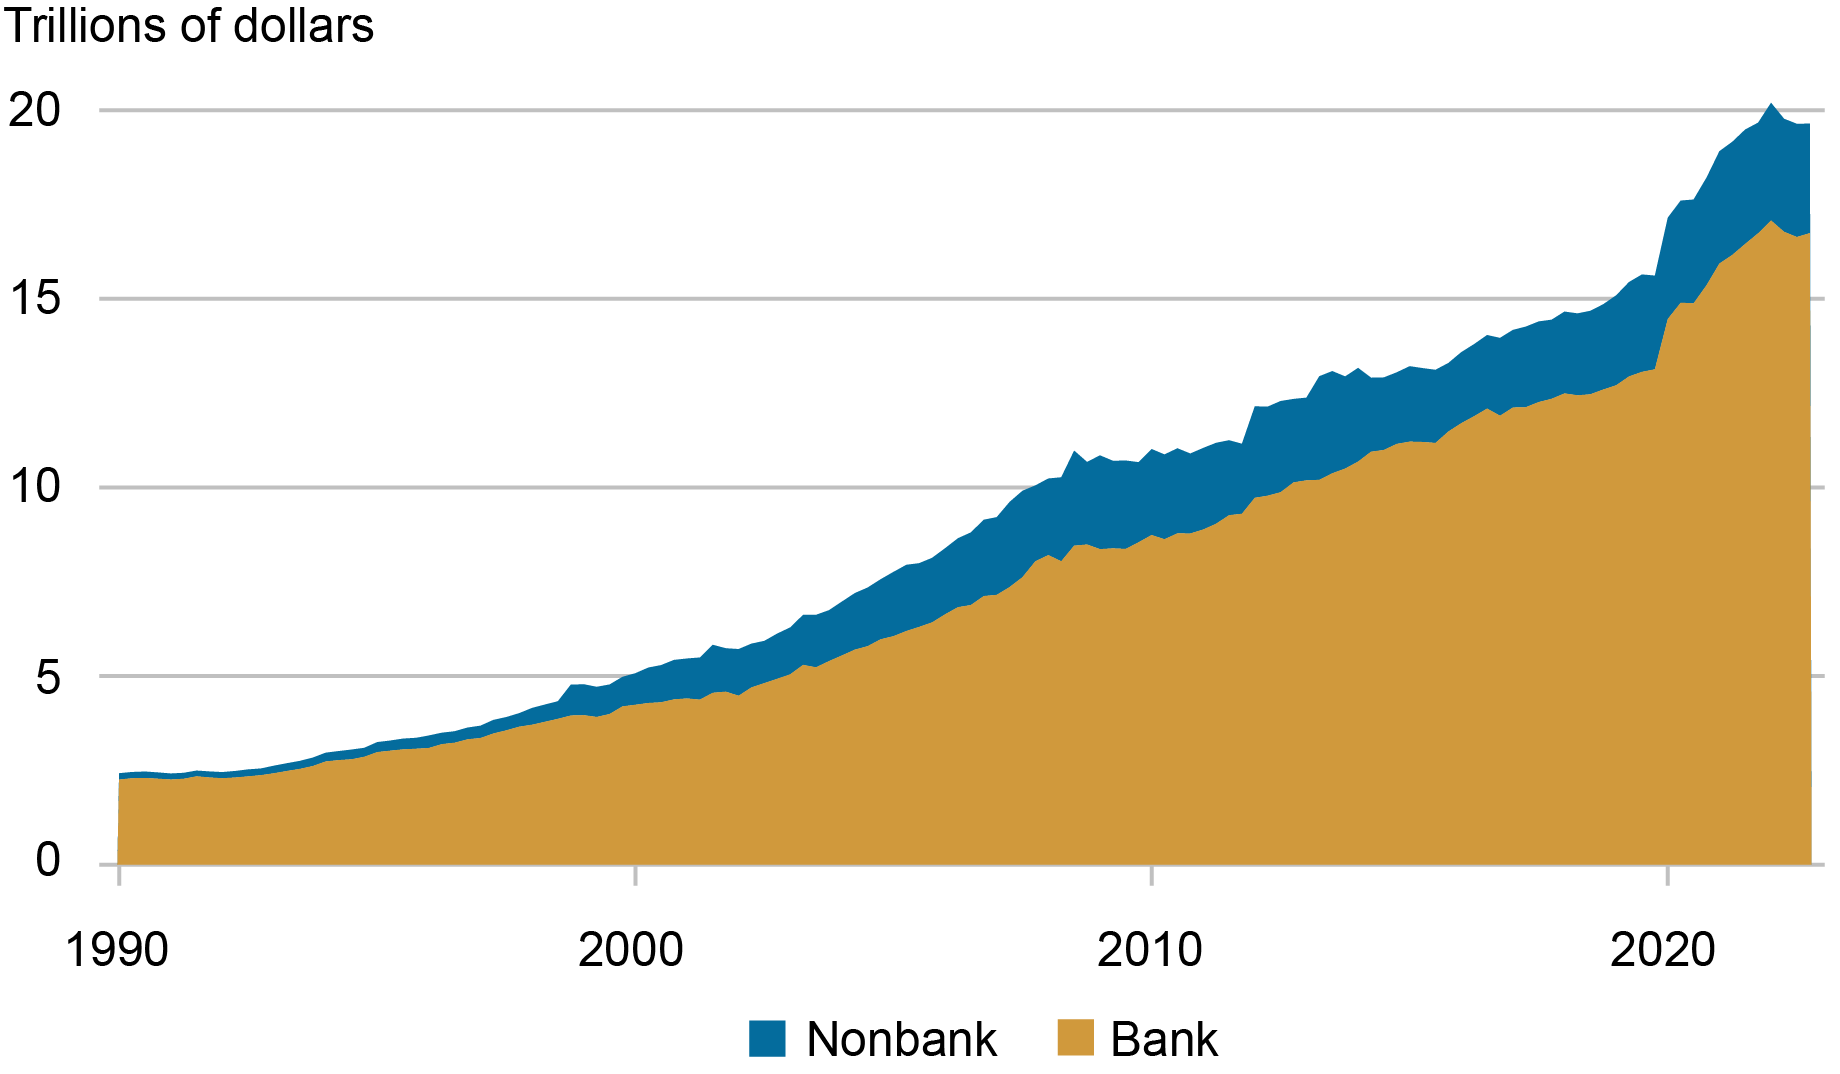
Sources: FR Y9-LP; FR Y9-C; FR Y-10; author’s calculations.
Note: We exclude the following BHCs: Goldman Sachs, Morgan Stanley, American Express, CIT Group, Ally Financial, Discover, M&T Bank, MetLife.
A similar picture appears when looking at the top 200 BHCs by operating revenues, defined as interest income plus noninterest income. In the next chart, we decompose BHC operating revenues, using nonbank operating revenue from the FR Y-9LP and total BHC operating revenue from the FR Y-9C (the consolidated balance sheet of BHCs). NBFIs’ share of total operating revenue has also been increasing over the years, representing approximately 21 percent of BHCs’ total operating revenue in 2022:Q4.
Composition of BHC Operating Revenue
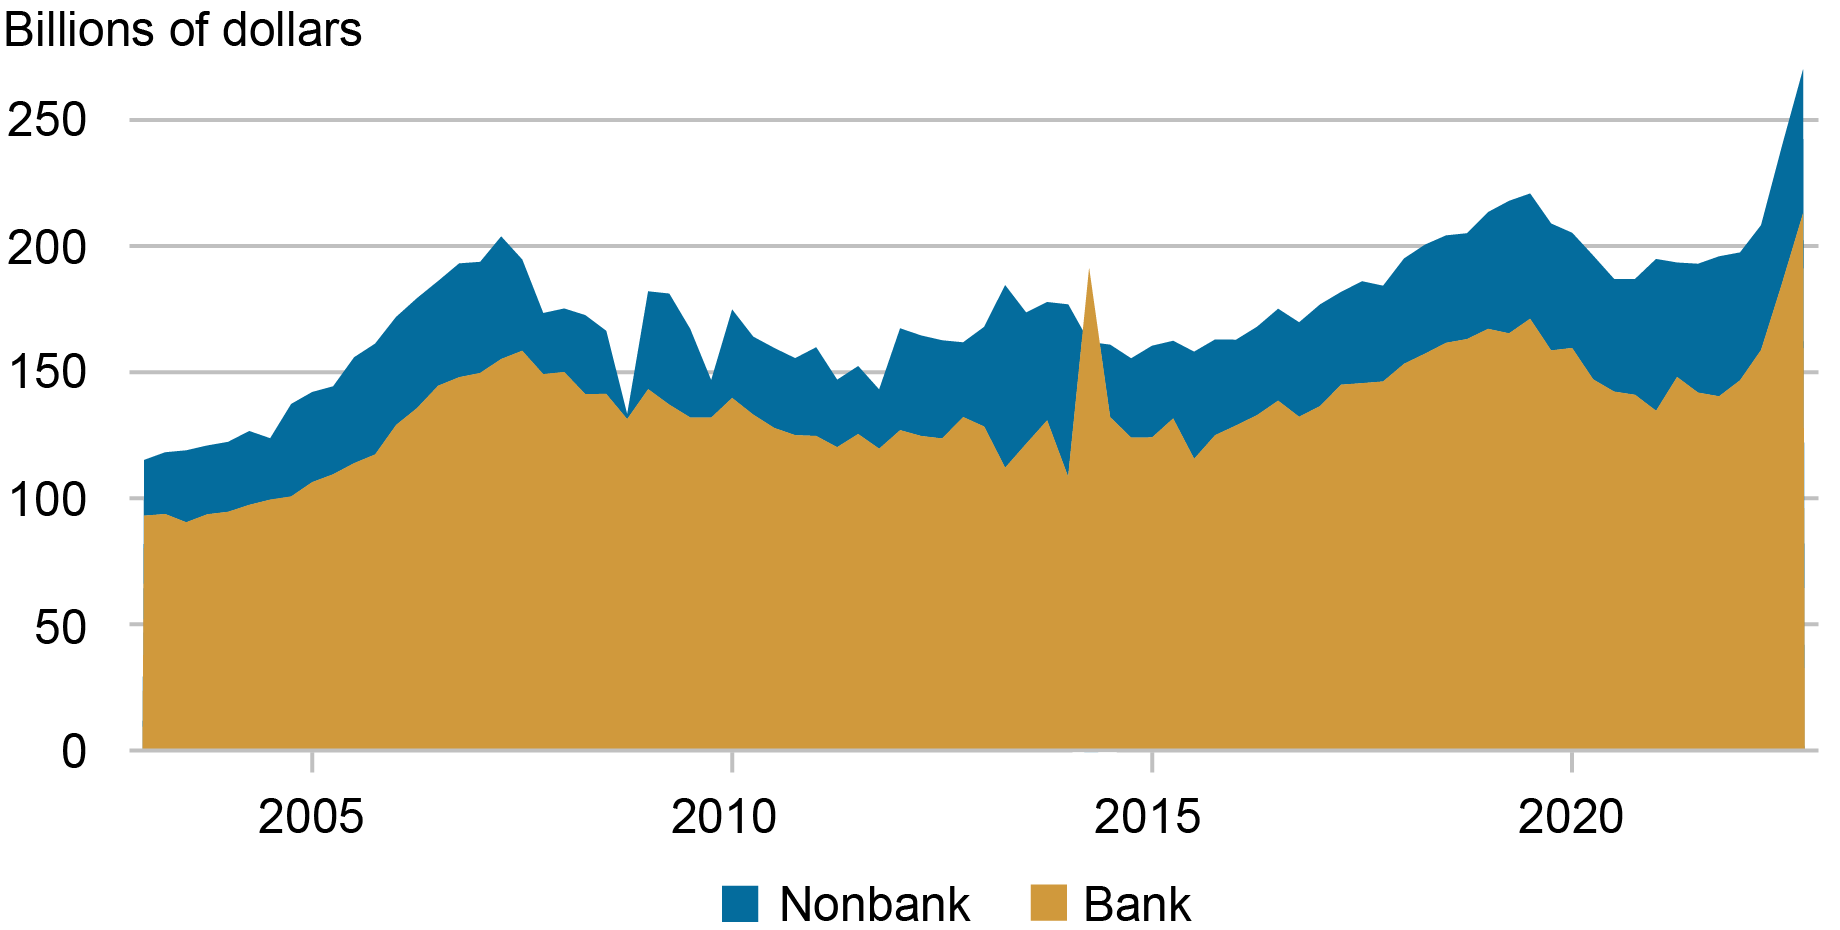
Sources: FR Y9-LP; FR Y9-C; FR Y-10; authors’ calculations.
Note: We exclude the following BHCs: Goldman Sachs, Morgan Stanley, American Express, CIT Group, Ally Financial, Discover, M&T Bank, MetLife.
While the evidence shows that NBFIs have had a significant role inside BHCs over the years, what is the relationship between NBFIs and “core” depository institutions? Did banking firms simply pursue a strategy of organizational diversification, or did they recognize the potential existence of conglomeration benefits between banks and NBFIs? In the latter case, ownership or controlling interests in both types of institutions may allow the exploitation of synergies, thus creating benefits for the organization as a whole.
To explore this issue, we consider the tiering structure inside each BHC in our database, which allows us to identify both the ultimate parent of a given subsidiary as well as the intermediate entities holding the subsidiary before the parent. In the diagram below, we show a stylized example of an organizational structure. The diagram establishes that “NBFI 1” is ultimately a subsidiary of the parent BHC and is directly owned by the depository institution “Bank 1,” which in turn is directly owned by the parent BHC.
Example of BHC Organizational Structure
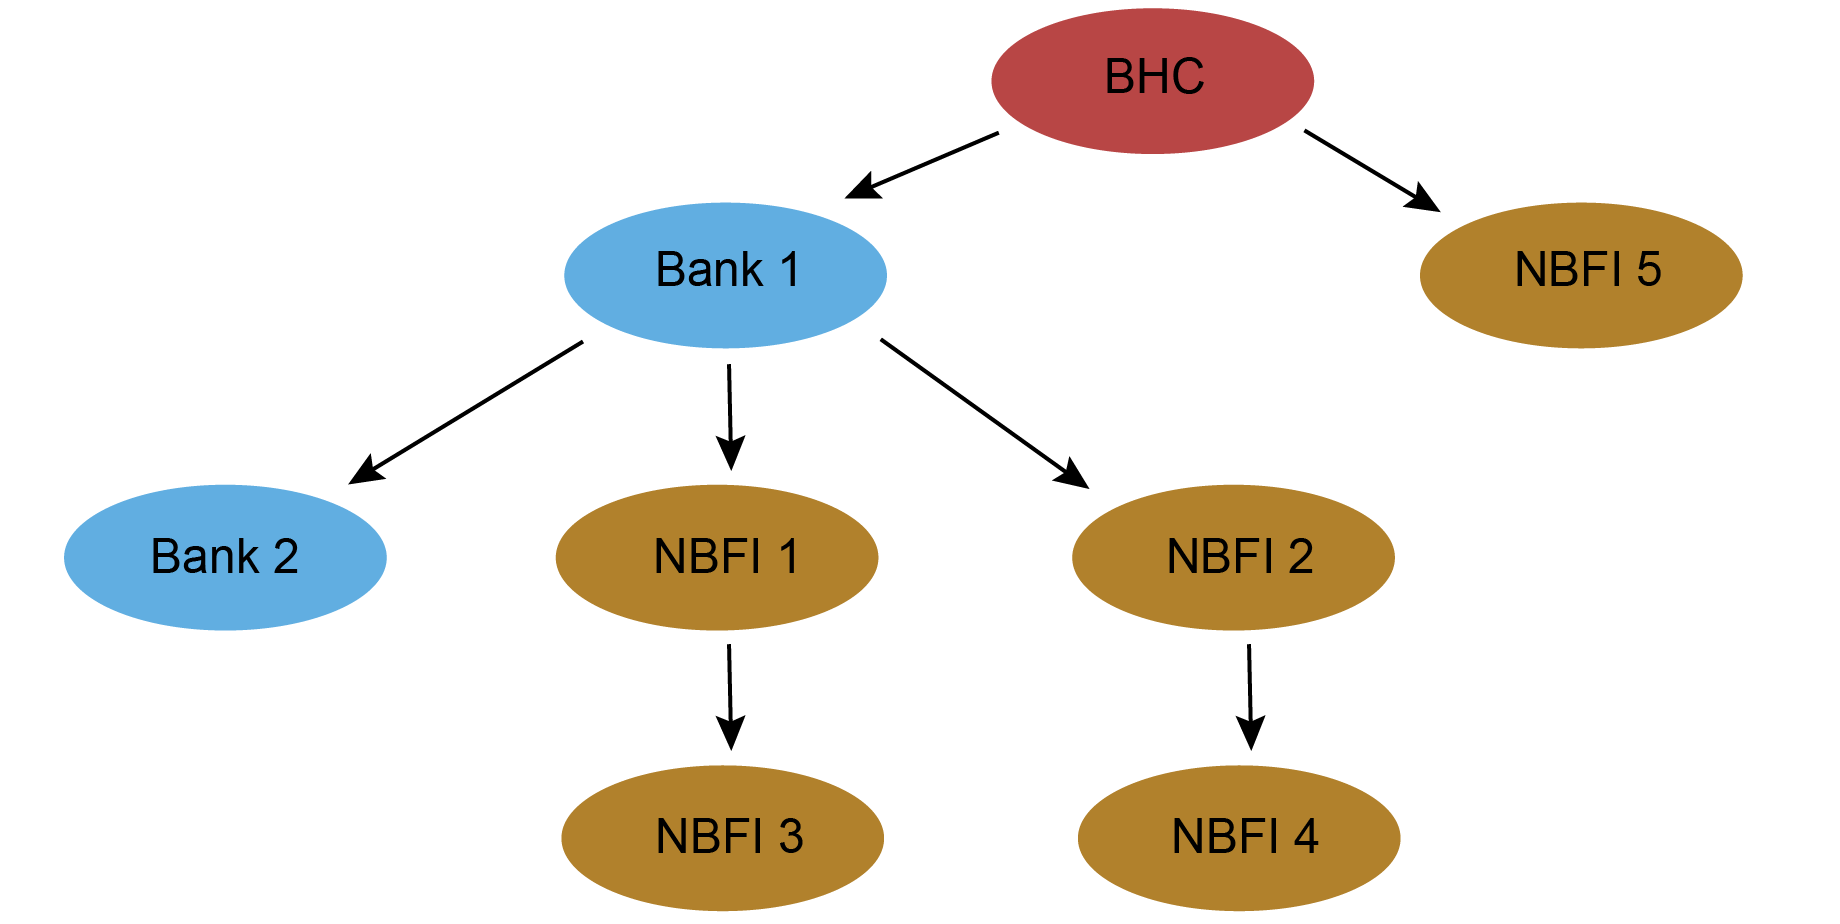
We argue that the decision to nest subsidiaries within internal control chains may reflect the capacity of those connected subsidiaries to generate conglomeration benefits. In particular, the extent to which depository institution subsidiaries of BHCs directly control NBFI subsidiaries (as “Bank 1” controls NBFIs 1-4) captures the extent to which the “core” components of a banking firm—the depository institutions—are closely connected to the nonbank side.
In the chart below, we show how the number of NBFI subsidiaries within the top 200 BHCs that are controlled by depository institutions, through both direct and indirect ownership, has evolved relative to the total number of NBFI subsidiaries under a BHC umbrella. We find that the number of nonbank subsidiaries nested under a depository institution, and thus part of a depository institution’s direct control chain within a BHC, has been quite substantial over the years. Nonbanks have cast a long shadow over core banking activities for a long time.
Composition of BHC Nonbank Subsidiaries by Control Chain
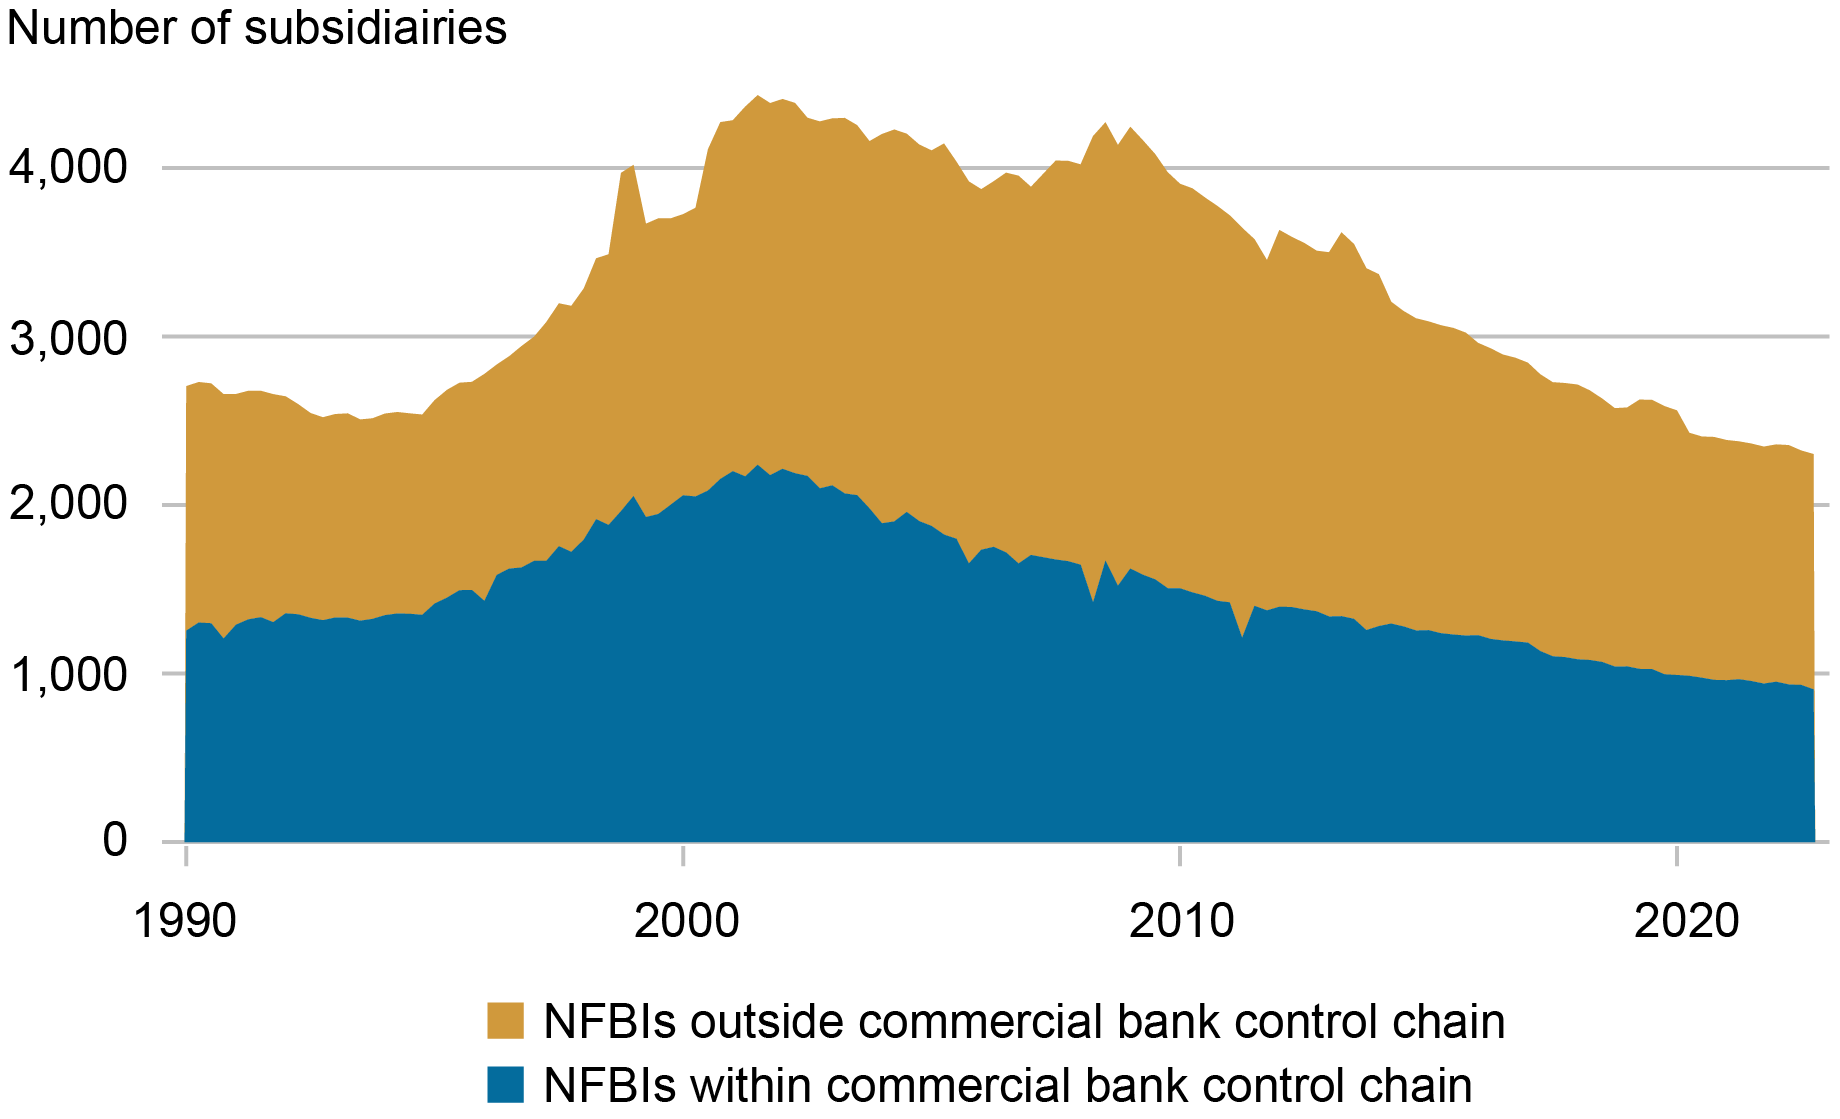
Sources: FR Y-10; authors’ calculations.
Note: We exclude the following BHCs: Goldman Sachs, Morgan Stanley, American Express, CIT Group, Ally Financial, Discover, M&T Bank, MetLife.
Nonbank Evolution and Living Wills
The same chart shows that, after the GFC, the count of NBFI subsidiaries decreases quite significantly. Interestingly, this trend reversal coincides with the largest BHCs becoming subject to resolution plans, or “living wills,” under the Dodd-Frank Act. Living wills forced banks to create a blueprint for how they could be resolved in bankruptcy without undue spillovers to the rest of the system. In particular, living wills are thought to have forced banks to create more organizational separation between depository institutions and nonbank activities. For example, Goldman Sachs in its 2015 living will submission writes: “We have established a number of criteria for a less complex and more rational legal entity structure with the goal of… protecting our insured depository institution from losses incurred by non-bank affiliates” (see page 15). However, given the history of banking firms adapting and evolving around regulatory boundaries, there is a chance that the bank-NBFI nexus we have identified may not have disappeared, but merely shifted to a different form. In a forthcoming paper, we investigate these questions at greater length, and we will report on our findings in subsequent posts.
Nicola Cetorelli is the head of Non-Bank Financial Institution Studies in the Federal Reserve Bank of New York’s Research and Statistics Group.

Saketh Prazad is a research analyst in the Federal Reserve Bank of New York’s Research and Statistics Group.
How to cite this post:
Nicola Cetorelli and Saketh Prazad, “The Nonbank Shadow of Banks,” Federal Reserve Bank of New York Liberty Street Economics, November 27, 2023, https://libertystreeteconomics.newyorkfed.org/2023/11/the-nonbank-shadow....

Monitoring Banks’ Exposure to Nonbanks: The Network of Interconnections Matters

Enhancing Monitoring of NBFI Exposure: The Case of Open-End Funds

Bank Funding during the Current Monetary Policy Tightening Cycle
Disclaimer
The views expressed in this post are those of the author(s) and do not necessarily reflect the position of the Federal Reserve Bank of New York or the Federal Reserve System. Any errors or omissions are the responsibility of the author(s).
Fiscal Rules are always ‘self-imposed’
I’ve noticed a sudden outburst of new thinking on the R4 ‘Today’ progamme this morning… They are calling fiscal rules ‘self-imposed’. They always are, by definition, of course. And if Hunt or Rachel Reeves were asked why they needed them, I expect there would be some rubbish about markets. As we know the markets only... Read more
The UK leech in charge is the Bank of England Governor:
In the light of today’s really underwhelming and deluded budget I thought this American article made some good points. After observing that most Americans know an awful lot about George Washington’s life, the author remarks: But it’s very unlikely that you heard about how George Washington died. After eating dinner in cold, wet clothes, he... Read more
Banks versus Hurricanes
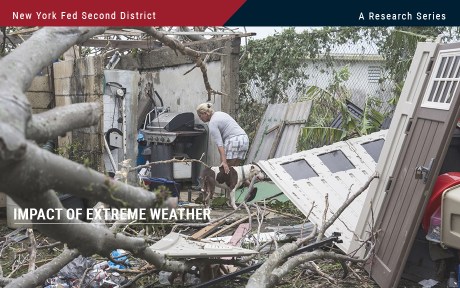
The impacts of hurricanes analyzed in the previous post in this series may be far-reaching in the Second District. In a new Staff Report, we study how banks in Puerto Rico fared after Hurricane Maria struck the island on September 17, 2017. Maria makes a worst case in some respects because the economy and banks there were vulnerable beforehand, and because Maria struck just two weeks after Hurricane Irma flooded the island. Despite the immense destruction and disruption Maria caused, we find that the island’s economy and banks recovered surprisingly quickly. We discuss the various protections—including homeowners’ insurance, federal aid, and mortgage guarantees—that helped buttress the island’s economy and banks.
Double Strike
Puerto Rico’s location in the Caribbean leaves it highly exposed to all manner of severe weather, including floods, droughts, tropical storms, and winter swells. Since 1955, FEMA has declared forty-five disasters there, twenty-eight of which were hurricanes or severe storms.
The Paths of Hurricanes Maria and Irma
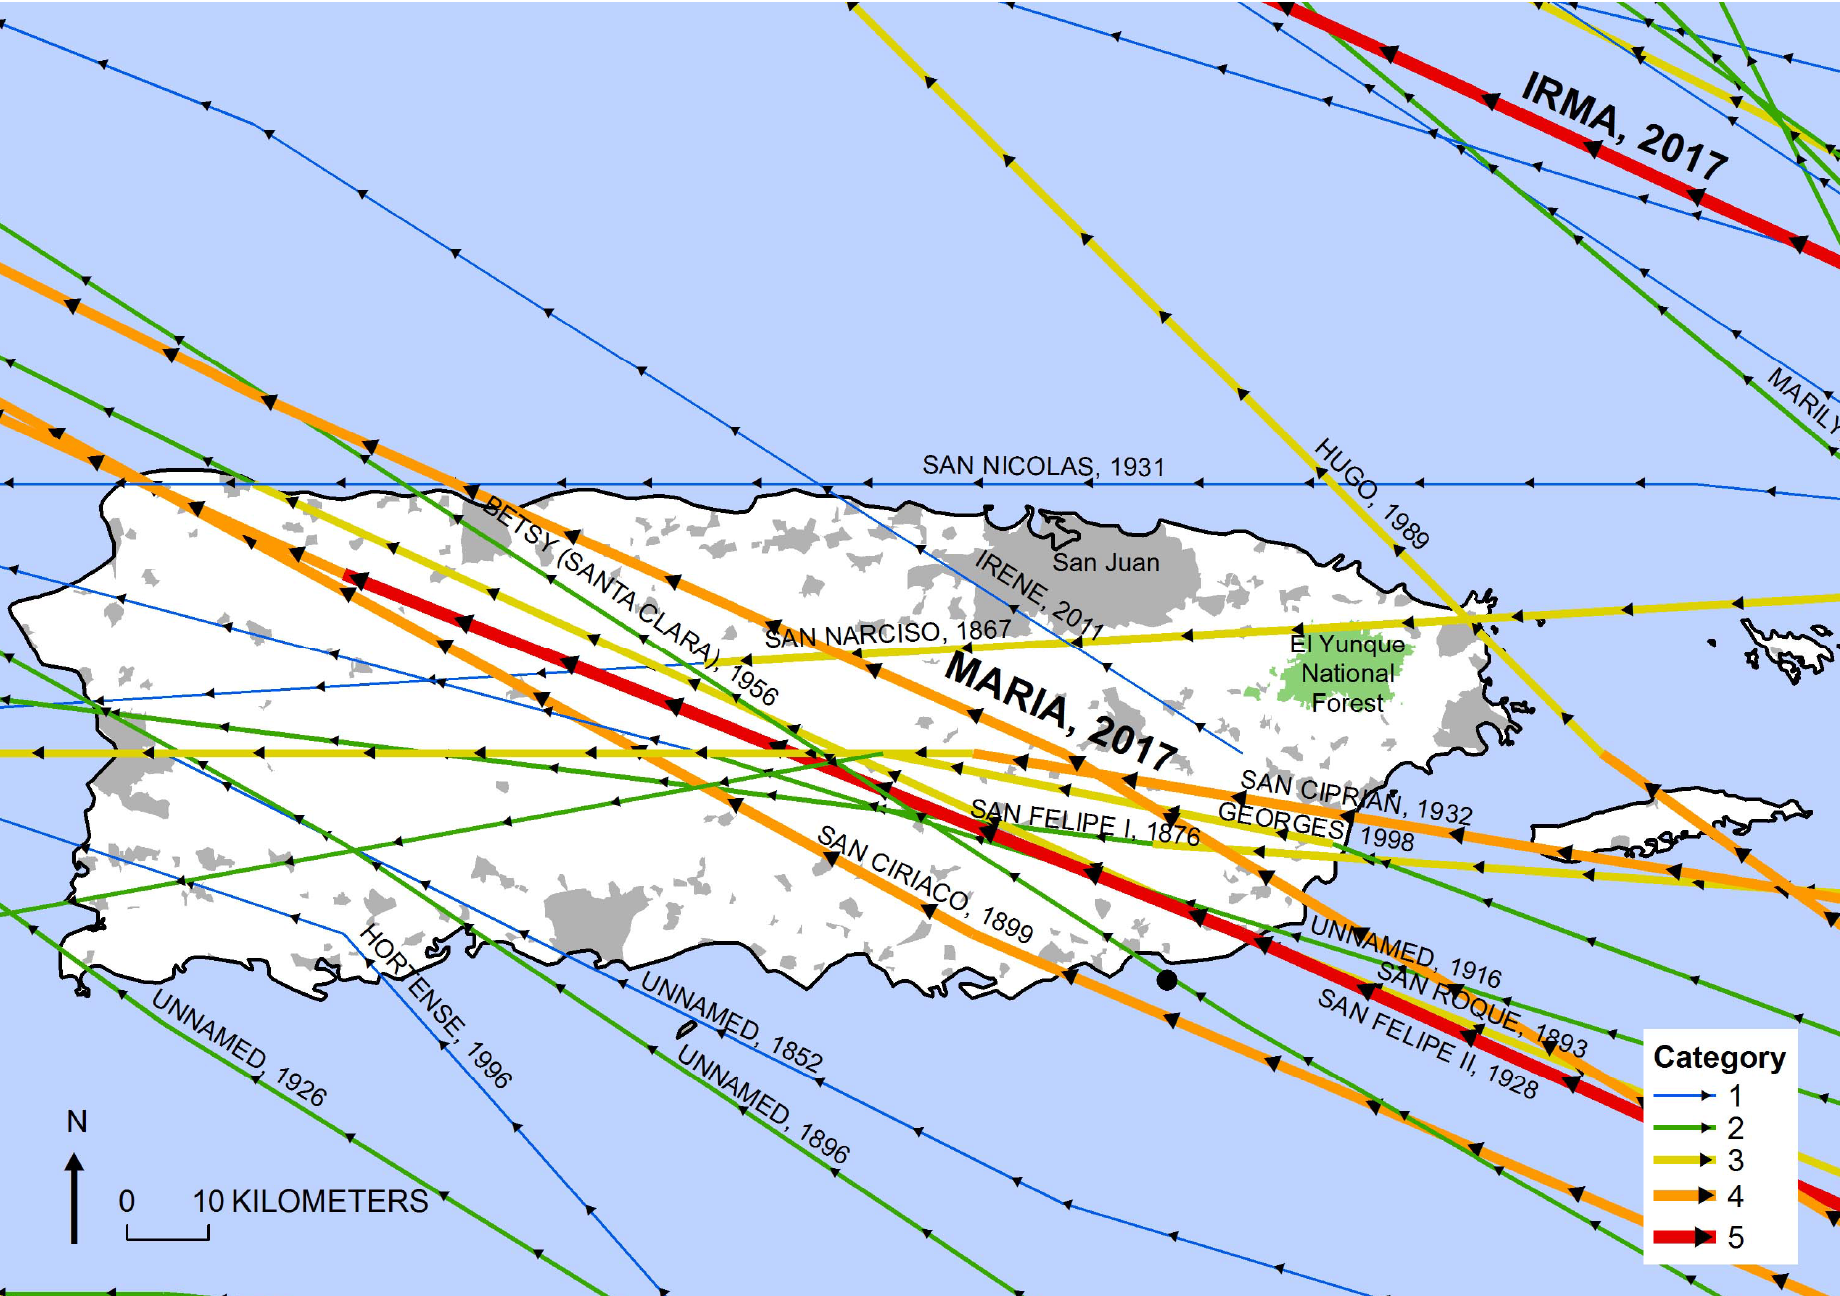
Source: U.S. Geological Survey.
The full fury of Irma (the eye) passed thirty miles north of the main island of Puerto Rico on September 6, but the island was still buffeted by 55 mph winds and a foot of rain in places. Culebra and Vieques, smaller islands off the main island, were especially hard hit. The island was still reeling from Irma when Maria struck full force on September 17, with winds of 155 mph and maximum rainfall of 38 inches in 48 hours. Maria destroyed 80 percent of the island’s electrical grid and blacked out most of Puerto Rico’s 3.4 million residents for months. Thousands of homes were damaged or destroyed. Flash floods caused landslides and destroyed many bridges. FEMA estimated damages from Maria at $90 billion, making it the third costliest hurricane in U.S. history. The combined damages from Maria and Irma nearly exceeded the island’s $104 billion GDP in 2016.
Economic Impact
The chart below tracks employment in Puerto Rico using August 2017 as the benchmark (100). The trend was flat or downward before Maria struck, reflecting longer-term economic difficulties that are discussed in our paper. Employment fell sharply, about 7 percent, after Maria but had fully recovered by July 2018. Interestingly, employment grew faster afterwards than before Maria, consistent with this recent study documenting positive medium-term effects of weather disasters on local employment and income.
Puerto Rico’s Employment Fell Sharply after Maria but Recovered Quickly
Index, August 2017 = 100
{"padding":{"auto":false,"left":28},"color":{"pattern":["#61AEE1","#B84645","#B1812C","#046C9D","#9FA1A8","#DCB56E"]},"interaction":{"enabled":true},"point":{"show":false},"data":{"groups":[],"labels":false,"type":"line","order":"desc","selection":{"enabled":false,"grouped":true,"multiple":true,"draggable":true},"x":"Date","xFormat":"%Y-%m-%d","rows":[["Date","All Employees: Total Private in Puerto Rico, Index Aug 2017=100, Monthly, Seasonally Adjusted"],["2016-01-01","101.3"],["2016-02-01","100.9"],["2016-03-01","100.9"],["2016-04-01","101.0"],["2016-05-01","100.9"],["2016-06-01","101.0"],["2016-07-01","101.0"],["2016-08-01","100.9"],["2016-09-01","101.3"],["2016-10-01","101.5"],["2016-11-01","101.2"],["2016-12-01","101.0"],["2017-01-01","101.1"],["2017-02-01","101.0"],["2017-03-01","101.0"],["2017-04-01","100.5"],["2017-05-01","100.6"],["2017-06-01","100.9"],["2017-07-01","100.1"],["2017-08-01","100.0"],["2017-09-01","99.0"],["2017-10-01","93.0"],["2017-11-01","94.7"],["2017-12-01","97.3"],["2018-01-01","96.7"],["2018-02-01","97.4"],["2018-03-01","97.8"],["2018-04-01","98.8"],["2018-05-01","99.2"],["2018-06-01","99.7"],["2018-07-01","100.3"],["2018-08-01","100.6"],["2018-09-01","100.8"],["2018-10-01","100.3"],["2018-11-01","100.9"],["2018-12-01","100.5"],["2019-01-01","101.8"],["2019-02-01","102.0"],["2019-03-01","102.5"],["2019-04-01","102.8"],["2019-05-01","102.8"],["2019-06-01","102.9"],["2019-07-01","102.6"],["2019-08-01","102.9"],["2019-09-01","103.3"],["2019-10-01","103.3"],["2019-11-01","103.4"],["2019-12-01","103.4"],["2020-01-01","103.3"]]},"legend":{"show":false,"position":"bottom"},"tooltip":{"show":true,"grouped":true},"axis":{"rotated":false,"x":{"show":true,"type":"timeseries","localtime":true,"tick":{"centered":false,"culling":false,"fit":true,"outer":true,"multiline":false,"multilineMax":0,"format":"%b %Y","values":["2016-01-01","2017-01-01","2018-01-01","2019-01-01","2020-01-01"]},"label":{"text":"","position":"outer-center"},"format":"%Y-%m-%d"},"y":{"show":true,"inner":false,"type":"linear","inverted":false,"tick":{"centered":false,"culling":false},"padding":{"top":3,"bottom":0},"primary":"","secondary":"","label":{"text":"","position":"outer-middle"},"max":105,"min":93},"y2":{"show":false,"inner":false,"type":"linear","inverted":false,"padding":{"top":3},"label":{"text":"","position":"outer-middle"}}},"grid":{"x":{"show":false,"lines":[],"type":"indexed","stroke":""},"y":{"show":true,"lines":[],"type":"linear","stroke":""}},"regions":[],"chartLabel":"Index, August 2017 = 100","trend":{"show":false,"label":"Trend"},"zoom":false,"subchart":false,"download":true,"downloadText":"Download chart","downloadName":"chart"}
Source: FRED, Federal Reserve Bank of St. Louis.
Notes: Chart plots total private employment in Puerto Rico relative to August 2017.
Bank Impact
There were three banks headquartered in Puerto Rico when Maria struck, institutions that collectively held 75 percent of all domestic deposits on the island. In our analysis, we compare these banks’ performance to a control group of U.S. banks that were not exposed to any type of weather disasters over the post-hurricane comparison period.
The first sign of trouble at banks is usually mounting loan delinquencies. The left panel below shows that delinquencies at Puerto Rico banks rose after Maria, particularly compared to the control, but the deterioration was modest and fairly short-lived. Bank income also fell sharply afterward, as shown in the right panel, but rebounded within two quarters.
Puerto Rico Banks’ Performance Deteriorated after Maria but Rebounded Quickly
Loan Delinquency Rate
Percent
Percent
{"padding":{"auto":false,"left":27,"right":27},"color":{"pattern":["#61AEE1","#B84645","#B1812C","#046C9D","#9FA1A8","#DCB56E"]},"interaction":{"enabled":true},"point":{"show":false},"data":{"groups":[],"labels":false,"type":"line","order":"desc","selection":{"enabled":false,"grouped":true,"multiple":true,"draggable":true},"x":"Date","xFormat":"%m\/%d\/%Y","rows":[["Date","Control (left scale)","Puerto Rico Banks (right scale)"],["1\/1\/2015","0.182","2.660"],["4\/1\/2015","0.196","2.755"],["7\/1\/2015","0.187","2.722"],["10\/1\/2015","0.172","2.632"],["1\/1\/2016","0.208","2.721"],["4\/1\/2016","0.197","2.572"],["7\/1\/2016","0.214","2.542"],["10\/1\/2016","0.173","2.543"],["1\/1\/2017","0.190","2.575"],["4\/1\/2017","0.194","2.529"],["7\/1\/2017","0.197","2.563"],["10\/1\/2017","0.167","2.639"],["1\/1\/2018","0.183","2.656"],["4\/1\/2018","0.197","2.694"],["7\/1\/2018","0.192","2.619"],["10\/1\/2018","0.156","2.543"],["1\/1\/2019","0.187","2.453"],["4\/1\/2019","0.191","2.397"],["7\/1\/2019","0.179","2.199"]]},"legend":{"show":true,"position":"bottom"},"tooltip":{"show":true,"grouped":true},"axis":{"rotated":false,"x":{"show":true,"type":"timeseries","localtime":true,"tick":{"centered":false,"culling":false,"fit":true,"outer":true,"multiline":false,"multilineMax":0,"format":"%Y:$QQ","values":["7\/1\/2015","7\/1\/2017","7\/1\/2019"]},"label":{"text":"","position":"outer-center"},"format":"%Y-%m-%d"},"y":{"show":true,"inner":false,"type":"linear","inverted":false,"tick":{"centered":false,"culling":false,"values":["0.4","0.3","0.2","0.1"]},"padding":{"top":3,"bottom":0},"primary":"","secondary":["Puerto Rico Banks","Puerto Rico Banks (right scale)"],"label":{"text":"","position":"outer-middle"},"max":0.4,"min":0.1},"y2":{"show":false,"inner":false,"type":"linear","inverted":false,"padding":{"top":3},"label":{"text":"","position":"outer-middle"},"max":3,"min":1,"tick":{"values":["3","2","1"]}}},"grid":{"x":{"show":false,"lines":[{"value":"7\/1\/2017","text":"","position":""}],"type":"indexed","stroke":""},"y":{"show":true,"lines":[],"type":"linear","stroke":""}},"regions":[],"chartLabel":"Percent","chartLabel2":"Percent","trend":{"show":false,"label":"Trend"},"zoom":false,"subchart":false,"download":true,"downloadText":"Download chart","downloadName":"chart"}
Bank Income
Log
{"padding":{"auto":false,"bottom":21,"right":22,"left":24},"color":{"pattern":["#61AEE1","#B84645","#B1812C","#046C9D","#9FA1A8","#DCB56E"]},"interaction":{"enabled":true},"point":{"show":false},"data":{"groups":[],"labels":false,"type":"line","order":"desc","selection":{"enabled":false,"grouped":true,"multiple":true,"draggable":true},"x":"Date","xFormat":"%m\/%d\/%Y","rows":[["Date","Control","Puerto Rico Banks"],["1\/1\/2015","N\/A","17.468"],["4\/1\/2015","12.632","17.877"],["7\/1\/2015","12.688","16.573"],["10\/1\/2015","12.605","17.199"],["1\/1\/2016","12.670","17.103"],["4\/1\/2016","12.711","17.087"],["7\/1\/2016","12.721","17.135"],["10\/1\/2016","12.644","17.141"],["1\/1\/2017","12.676","17.155"],["4\/1\/2017","12.771","17.226"],["7\/1\/2017","12.803","16.446"],["10\/1\/2017","12.632","17.177"],["1\/1\/2018","12.831","17.279"],["4\/1\/2018","12.916","17.307"],["7\/1\/2018","12.960","17.413"],["10\/1\/2018","12.874","17.593"],["1\/1\/2019","12.892","17.477"],["4\/1\/2019","12.968","17.469"],["7\/1\/2019","13.042","17.114"]]},"legend":{"show":true,"position":"bottom"},"tooltip":{"show":true,"grouped":true},"axis":{"rotated":false,"x":{"show":true,"type":"timeseries","localtime":true,"tick":{"centered":false,"culling":false,"fit":true,"outer":true,"multiline":false,"multilineMax":0,"format":"%Y:$QQ","values":["07\/01\/2015","07\/01\/2017","07\/01\/2019"]},"label":{"text":"","position":"outer-center"},"format":"%Y-%m-%d"},"y":{"show":true,"inner":false,"type":"linear","inverted":false,"tick":{"centered":false,"culling":false,"values":["18","16","14","12"]},"padding":{"top":3,"bottom":0},"primary":"","secondary":"","label":{"text":"","position":"outer-middle"},"max":18,"min":12},"y2":{"show":false,"inner":false,"type":"linear","inverted":false,"padding":{"top":3},"label":{"text":"","position":"outer-middle"}}},"grid":{"x":{"show":false,"lines":[{"value":"07\/01\/2017","text":"","position":""}],"type":"indexed","stroke":""},"y":{"show":true,"lines":[],"type":"linear","stroke":""}},"regions":[],"chartLabel":"Log","trend":{"show":false,"label":"Trend"},"zoom":false,"subchart":false,"download":true,"downloadText":"Download chart","downloadName":"chart"}
Sources: Bank call reports and Y9-C filings.
Notes: Panels show means for each period for three Puerto Rico-headquartered banks and a control group of U.S. banks that were not exposed to any (FEMA-declared) weather disaster between 2017:Q3 and 2019:Q3. The vertical line indicates when Maria struck. Delinquency rate = 90 days+ past due. Income is measured in log terms.
We confirmed these effects more rigorously in our paper, where we control for individual bank characteristics and economic conditions. We also look at other bank performance measures, such as capital and default risk, but do not find significant changes. The modest (or null) impacts we find for Puerto Rico banks, though possibly surprising, are consistent with the results of other recent studies (Blickle et al., 2022; Brei et al., 2016; Gallagher and Hartley, 2017).
Mitigated Disasters
Despite the aggregate catastrophic impacts of Irma-Maria, multiple layers of protection helped mitigate the impact (see chart below).
Layers of Disaster Protection

The first mitigant is homeowner’s and flood insurance. By enabling homeowners to repair damaged property, rather than abandon it, insurance protects lenders indirectly.
Federal disaster assistance may also provide indirect protection. Puerto Rico received $20.6 billion in FEMA aid after Irma-Maria, $19.3 billion in public assistance for rebuilding infrastructure, and $1.4 billion in individual assistance to aid uninsured households and individuals. By supporting employment and recovery, this aid may have benefited banks indirectly, but the benefit is difficult to quantify.
Mortgage insurance through the Veteran’s Administration and Federal Housing Administration provided direct protection to banks. These agencies guarantee mortgage repayment in the event of default due to damage to the home or unemployment (among other events). Using McDash data, we found that over 30 percent of mortgages in Puerto Rico were covered by one or the other guarantee when Irma-Maria hit. Loss rates on those mortgages through November 2019 were just 0.1 to 0.2 percent, compared to 1 percent on conventional mortgages without private or government mortgage insurance.
Borrower’s home equity is another layer of direct protection to banks, one they control though their underwriting. In Puerto Rico, however, home equity had been declining for years before 2017, as the long economic downturn depreciated home prices. Thus, home equity levels likely did not provide strong support to banks holding these mortgages.
Takeaways
Puerto Rico banks were surprisingly resilient against the back-to-back hurricanes that wracked the island in September 2017, thanks to the mitigating effects of property insurance, federal mortgage insurance and disaster assistance, and, to a lesser extent, their own underwriting. This finding is reassuring from a financial stability perspective, but also for households that might need additional credit to rebuild and recover from weather disasters. We caution, however, that these mitigants may themselves be threatened by climate change if private and federal insurers withdraw from disaster zones or increase coverage costs prohibitively or if federal disaster assistance becomes scarcer.

Peter Anagnostakos is a quality management supervising examiner in the Federal Reserve Bank of New York’s Supervision Group.
Jason Bram was a research officer in the Federal Reserve Bank of New York’s Research and Statistics Group.

Benjamin Chan is an institutional supervision program manager in the Federal Reserve Bank of New York’s Supervision Group.

Natalia Fischl-Lanzoni is a research analyst in Financial Intermediation in the Federal Reserve Bank of New York’s Research and Statistics Group.

Hasan Latif is an institutional supervision supervising examiner in the Federal Reserve Bank of New York’s Supervision Group.

James M. Mahoney is an institutional supervision program director in the Federal Reserve Bank of New York’s Supervision Group.

Donald P. Morgan is a financial research advisor on Banking Studies in the Federal Reserve Bank of New York’s Research and Statistics Group.

Ladd Morgan is a capital markets risk supervising examiner in the Federal Reserve Bank of New York’s Supervision Group.

Ivelisse Suarez is an institutional supervision supervising examiner in the Federal Reserve Bank of New York’s Supervision Group.
How to cite this post:
Peter Anagnostakos, Jason Bram, Benjamin Chan, Natalia Fischl-Lanzoni, Hasan Latif, James M. Mahoney, Don Morgan, Ladd Morgan, and Ivelisse Suarez, “Banks versus Hurricanes,” Federal Reserve Bank of New York Liberty Street Economics, November 20, 2023, https://libertystreeteconomics.newyorkfed.org/2023/11/banks-versus-hurri....

Climate Change and Financial Stability: The Weather Channel

Banks versus Hurricanes: A Case Study of Puerto Rico after Hurricanes Irma and Maria

Disclaimer
The views expressed in this post are those of the author(s) and do not necessarily reflect the position of the Federal Reserve Bank of New York or the Federal Reserve System. Any errors or omissions are the responsibility of the author(s).
Cash, cards and crypto…
There was an interesting conversation on you tube here between Novara Media’s Aaron Bastani and Brett Scott, author of the book ‘Cloud Money: Cash, Cards, Crypto and the War for our Wallets’. The author was progressive and interesting – though little attention was paid – in what has become unfortunately, normal Novara Media style, to... Read more
How Do Banks Lend in Inaccurate Flood Zones in the Fed’s Second District?

In our previous post, we identified the degree to which flood maps in the Federal Reserve’s Second District are inaccurate. In this post, we use our data on the accuracy of flood maps to examine how banks lend in “inaccurately mapped” areas, again focusing on the Second District in particular. We find that banks are seemingly aware of poor-quality flood maps and are generally less likely to lend in such regions, thereby demonstrating a degree of flood risk management or risk aversion. This propensity to avoid lending in inaccurately mapped areas can be seen in jumbo as well as non-jumbo loans, once we account for a series of confounding effects. The results for the Second District largely mirror those for the rest of the nation, with inaccuracies leading to similar reductions in lending, especially among non-jumbo loans.
Inaccurate Flood Maps
As manager of the National Flood Insurance Program (NFIP), the Federal Emergency Management Agency (FEMA) works with communities to draw maps that denote the risk of a catastrophic flood occurring at least once in 100 years. Areas that are at risk of such flooding are considered to have a 1 percent (or more) annual flood risk. An important implication of being in a flood zone is the insurance requirement for mortgage borrowers. Specifically, any mortgage applicant in a flood zone whose mortgage meets certain criteria—such as being eligible for securitization or being made by a financial institution—must buy flood insurance. The program—as well as the implications for the mortgage market—are discussed in previous Liberty Street Economics posts in this series (see here or here).
In our previous post, we discussed the fact that certain flood maps may be inaccurate. These inaccuracies arise partly because it takes time to update the maps in the face of climate change, and partly because of improvements and other changes made to local infrastructure and building materials that take time to be reflected in official flood maps. We use property-level information on flood damage exposure from CoreLogic as well as digitized flood maps for 2022 to define inaccuracies (as described in our previous post).
Maps can be inaccurate in one of two ways: either they designate too much of an area as being a “flood risk,” or they designate too little. For the purposes of this post, we focus only on the latter issue and define two categories of inaccuracy. If a property faces significant flooding damage (highest damage quartile) but is not “mapped” into a flood zone, its map is “very inaccurate.” If a property faces moderate damage but is not covered by a flood zone, its map is simply “inaccurate.” All other properties are either accurately mapped or correctly excluded from a flood map because they face no flood risk. We collapse this data at the census-tract level and then calculate the share of each census tract that is “very inaccurate” and “inaccurate” in the analyses below. This somewhat coarse analysis is necessary as we cannot use address-specific mortgage data. As before, we focus on properties in the Second District as well as the nation as a whole for mortgage applications in 2019 and 2020.
A key question is whether lenders are aware of—and responsive to—these inaccuracies. To this end, we make use of Home Mortgage Disclosure Act (HMDA) mortgage data at the census tract level. We first look at simple correlations between the share of a census tract that is “very inaccurate” and the acceptance rate of loan applications. In the left panel of the chart below, we see that for non-jumbo (“conforming”) loans, there is very little relationship between the two variables. This is possibly a consequence of many of these loans moving off of a bank’s balance sheet in the near term. However, jumbo loans, which are more likely to be retained by banks, show a much more negative correlation, as shown in the right panel. In other words, census tracts in which a greater proportion of homes are inaccurately mapped see a lower acceptance rate for jumbo applications, on average.
Lending in Areas with Inaccurate Flood Maps
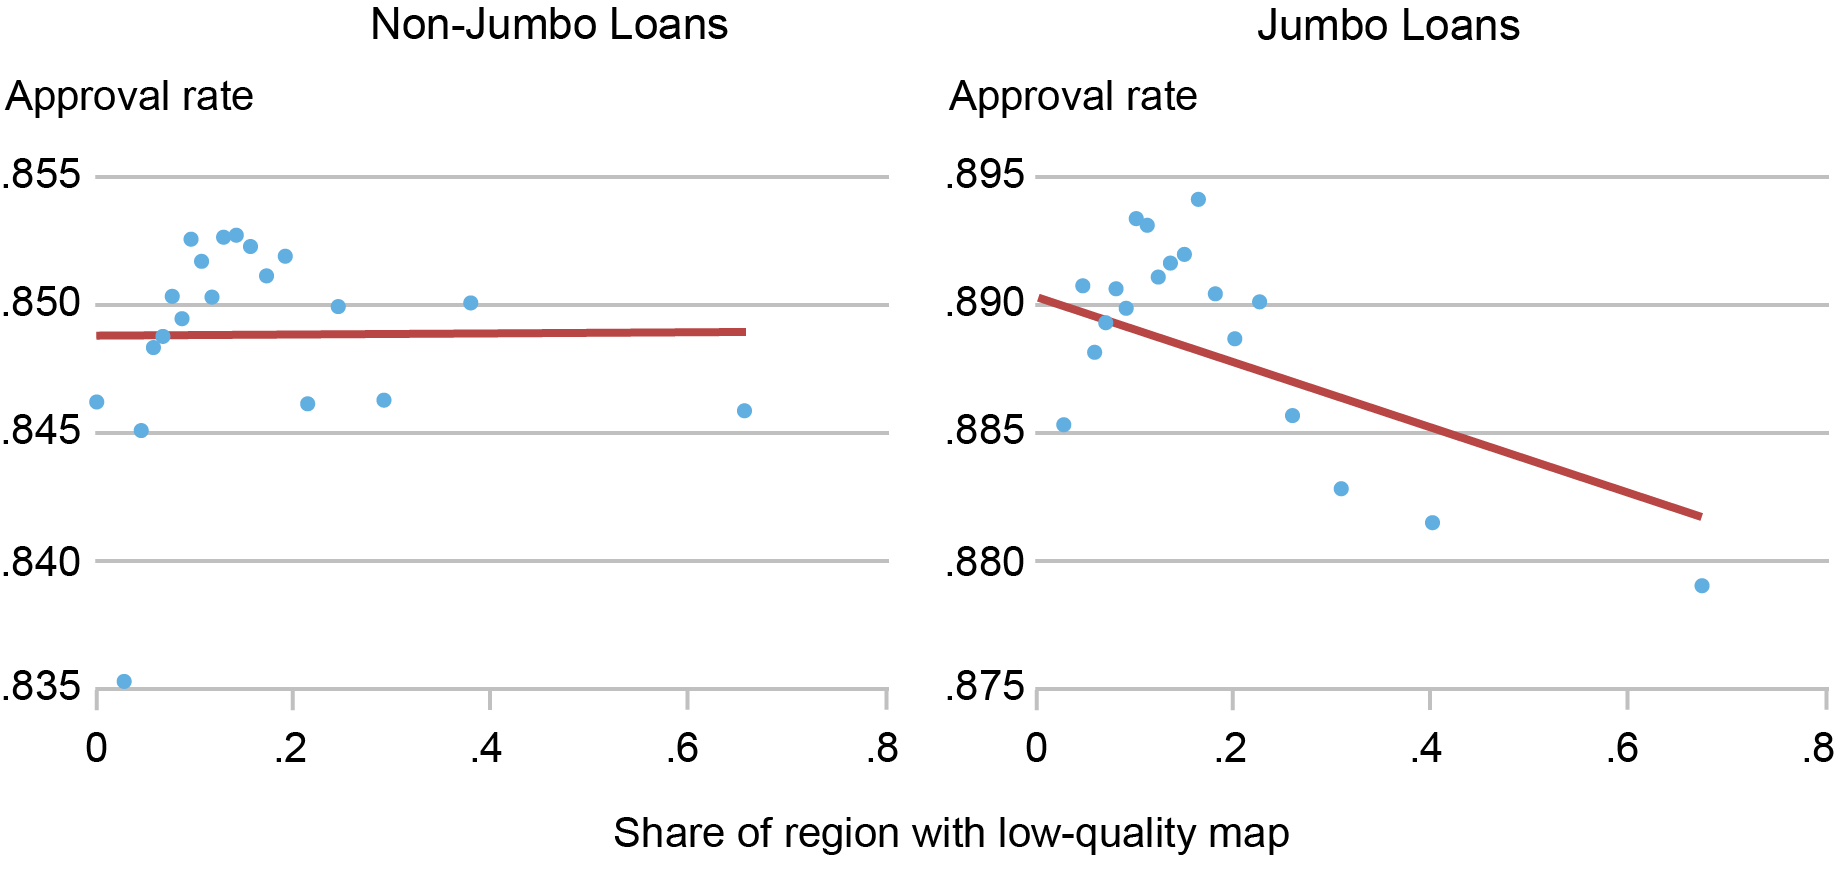
Sources: Authors’ calculations; Federal Emergency Management Agency (FEMA); Home Mortgage Disclosure Act (HMDA) data; CoreLogic.
Notes: This chart shows binscatter plots that relate the share of a census tract that is “very inaccurately” mapped to the loan acceptance rate. It includes time controls but no other adjustments. Data cover the Second District excluding Puerto Rico and the U.S. Virgin Islands and are split into conforming (non-jumbo) and non-conforming (jumbo) loans.
This result is possibly a reflection of bank risk management. Retaining a loan that is subject to flood risk but that may not have flood insurance (or may even be ineligible for insurance from the NFIP if the community does not participate) may represent too risky a proposition. However, since a whole host of other factors go into a mortgage application decision, we use regression analysis to control for these other factors.
The Effect of Flood Map Accuracy on Lending
Our outcome variable is the loan acceptance probability as measured by a variable that takes the value of “1” if an application is accepted. We regress the loan acceptance probability on application amounts in dollars, borrower characteristics (income, gender, race, and loan-to-income ratio), the county where the property is located interacted with time, the average census tract income, past flood damages, and a host of other characteristics. We also include a variable that denotes the share of properties in a census tract that are (1) “inaccurately mapped” or (2) “very inaccurately mapped.” Results are shown in the chart below.
Effect of Inaccurate Maps, after Accounting for Borrower and Region Characteristics
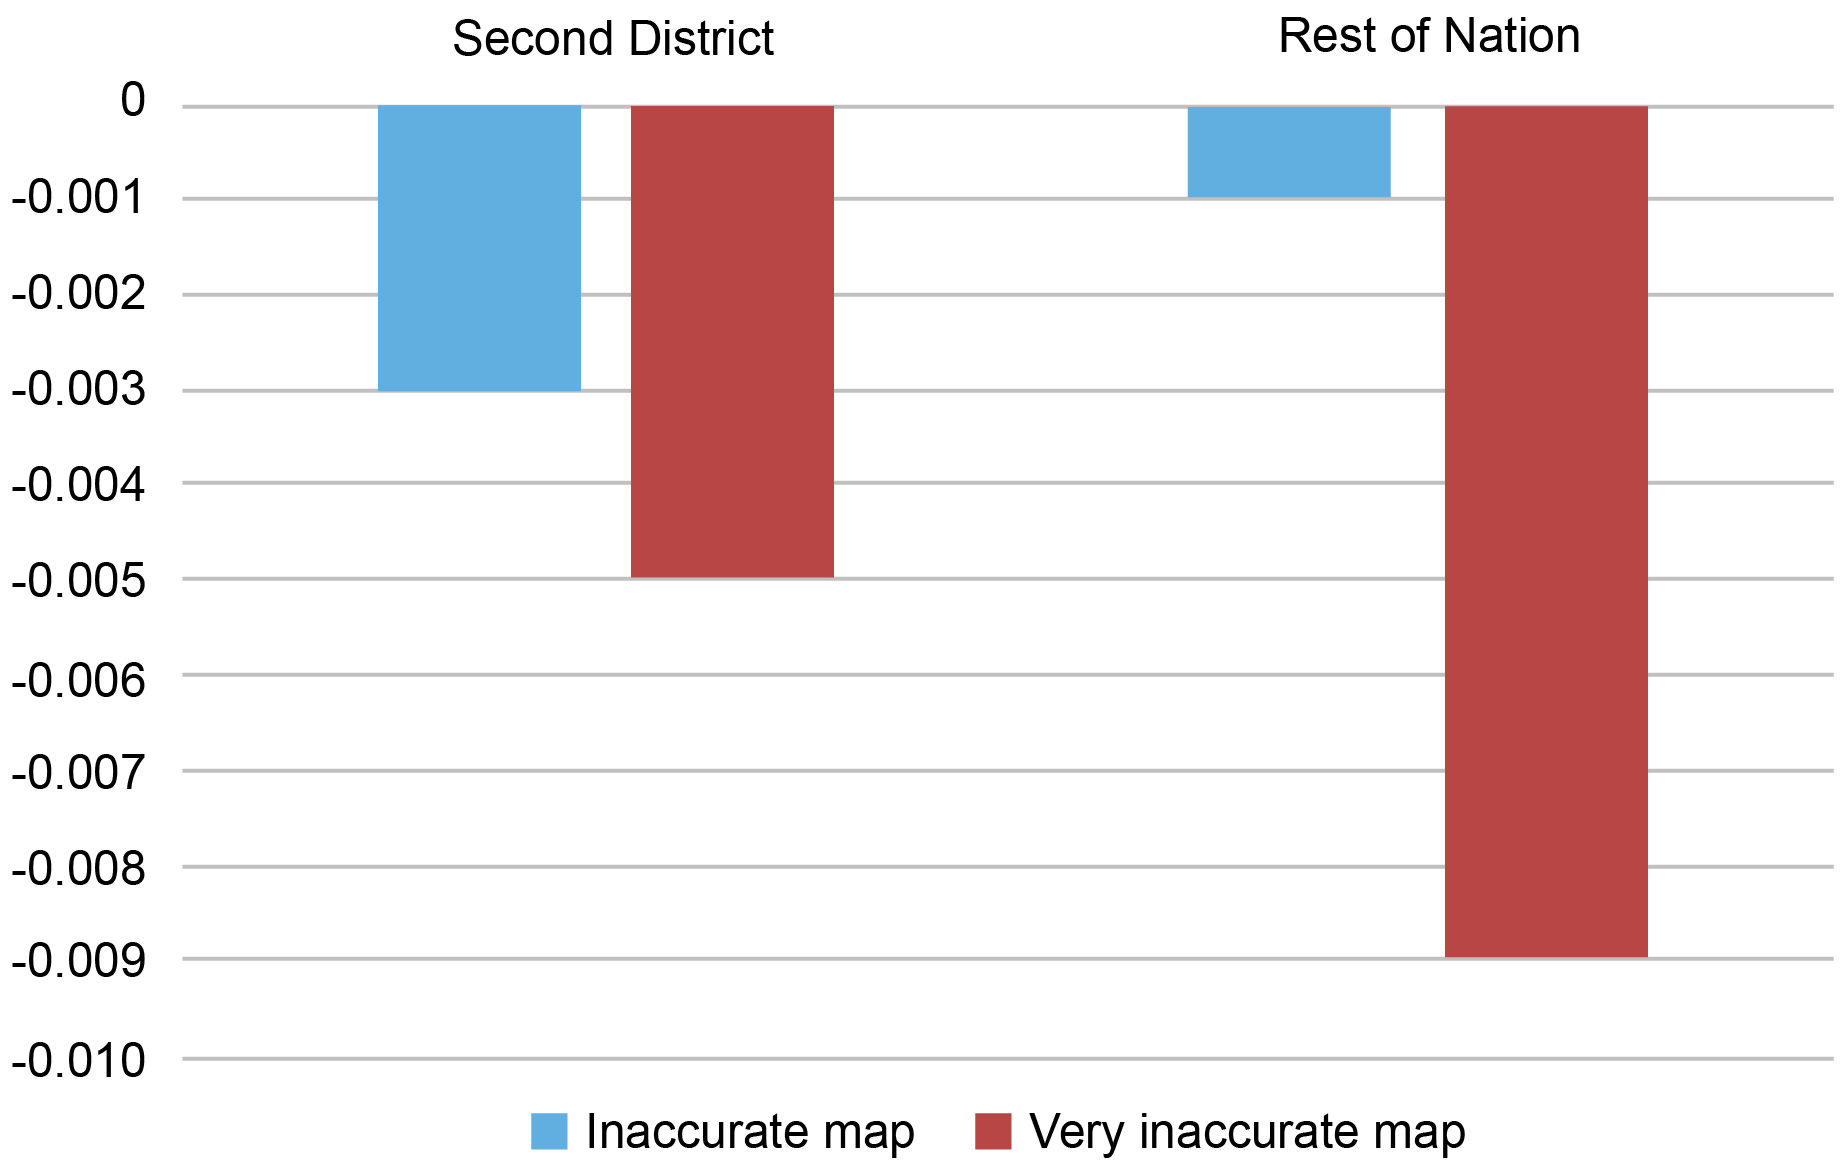
Sources: Authors’ calculations; Federal Emergency Management Agency (FEMA); Home Mortgage Disclosure Act (HMDA) data; CoreLogic.
Notes: This chart shows the key coefficients for a linear probability regression that relates loan acceptance rates (1= accepted by borrower and bank) to a host of loan, region, and borrower characteristics, as well as key variables that denote the share of properties in a census tract that are “inaccurately mapped” or “very inaccurately mapped.” It shows the Second District (excluding Puerto Rico and the U.S. Virgin Islands) and the rest of the nation separately and focuses only on the coefficients of interest for non-jumbo loans.
We find that bank loans in areas that have inaccurate maps have a somewhat lower acceptance rate, all else equal. Areas that have very inaccurate maps see a more pronounced reduction in acceptances. If we include borrower characteristics—especially borrower income and loan-to-value ratios—the relationship between the share of inaccurately mapped properties and loan acceptance rates becomes less negative among jumbo loans than in the raw correlation. This may be a reflection of the ability of these borrowers to make a larger down payment to help offset the bank’s perceived risk.
It is worth mentioning that while these reductions in the acceptance rates are statistically significant, they are small relative to the effects of applicant income or wealth. A Second District community in which 10 percent of all properties are inaccurately mapped may see a reduction of 3 percent in acceptance rates. A 10 percent drop in income would see a rejection response that is fourfold larger. Our results likely reflect some residual bank risk aversion—not all conforming loans are securitized, after all. Moreover, banks that are aware of the inaccurate mapping likely expect maps to change following future updates. Since lenders/servicers have to ensure that pre-existing borrowers who are newly mapped into flood zones buy insurance after a grace period expires, they may be ex ante unwilling to lend to these inaccurately mapped households. Alternatively, banks may be worried about the ability of the marginal borrower to make the required insurance payments.
The reaction of lenders to inaccurate maps in the Second District is comparable to that in the nation as a whole, especially among non-jumbo borrowers. The response to very inaccurate maps is somewhat stronger in southern states, which may reflect increased risk of catastrophic flooding. While we do not fully account for a wide range of region-specific factors that may differ between the Second District and the rest of the nation, we still find that bank responses to inaccuracies are broadly comparable—that is to say, they reduce lending. This suggests that bank reactions to inaccurate maps are not state-specific but are more likely to be a reflection of general risk aversion.
Concluding Remarks
We find that banks are somewhat responsive to inaccurately mapped areas. They are less willing to lend in regions with poor flood maps, even if these loans can be securitized. In this regard, the Second District is no different than the rest of the nation. While bank reactions to inaccurate maps are small, the presence of statistically meaningful lending differences implies that banks manage and are aware of flood risk, at least to some degree. The next post in this series exploits the newly updated maps to examine whether firms take flood risk into account when choosing their business locations.

Kristian Blickle is a financial research economist in Climate Risk Studies in the Federal Reserve Bank of New York’s Research and Statistics Group.
Katherine Engelman is a former data scientist in the Data and Analytics Office in the Bank’s Technology Group.

Theo Linnemann is a data scientist in the Data and Analytics Office in the Bank’s Technology Group.

João A.C. Santos is the director of Financial Intermediation Policy Research in the Federal Reserve Bank of New York’s Research and Statistics Group.
How to cite this post:
Kristian S. Blickle, Katherine Engelman, Theo Linnemann, and João A. C. Santos, “How Do Banks Lend in Inaccurate Flood Zones in the Fed’s Second District?,” Federal Reserve Bank of New York Liberty Street Economics, November 13, 2023, https://libertystreeteconomics.newyorkfed.org/2023/11/how-do-banks-lend-....
Potential Flood Map Inaccuracies in the Fed’s Second District

The Adverse Effect of “Mandatory” Flood Insurance on Access to Credit

Moving Out of a Flood Zone? That May Be Risky!
Disclaimer
The views expressed in this post are those of the author(s) and do not necessarily reflect the position of the Federal Reserve Bank of New York or the Federal Reserve System. Any errors or omissions are the responsibility of the author(s).
Pages
- « first
- ‹ previous
- 1
- 2
- 3