Credit
Learning by Bouncing: Overdraft Experience and Salience

Overdraft credit, when banks and credit unions allow customers to spend more than their checking account holds, has many critics. One fundamental concern is whether overdrafts are salient—whether account holders know how often they overdraw and how much it costs them. To shed light on this question, we asked participants in the New York Fed’s Survey of Consumer Expectations about their experience with and knowledge of their banks’ overdraft programs. The large majority knew how often they overdrew their account and by how much. Their overdraft experience, we find, begets knowledge; of respondents who overdrew their account in the previous year, 84 percent knew the fee they were charged, roughly twice the share for other respondents. However, even experienced overdrafters were relatively unaware of other overdraft terms and practices, such as the maximum overdraft allowed or whether their financial institution processed larger transactions first.
Background
Overdraft credit was transformed with the advent of electronic debiting in the 1990s. Before then, bankers decided case by case whether to cover checks as a courtesy for trusted customers. As debit cards and automated teller machines (ATM) proliferated, banks began adopting automated programs that determine in real time whether to allow an overdraft. These “bounce protection” programs (so called after bounced checks) were marketed by industry consultants to banks and credit unions as a potential benefit to depositors and banks alike. Financial institutions can only cover overdrafts of customers who have opted into their overdraft program (see Dlugosz, Melzer, and Morgan for more on overdraft credit).
Overdraft Surveys
Overdraft credit is not tracked by the major credit bureaus, so most of what we know of it comes from surveys and focus groups. The Consumer Financial Protection Bureau (CFPB) held interviews and focus groups with thirty-six low- and moderate-income households about their experiences with overdraft credit, finding that “(m)any expressed confusion about overdraft coverage during and after account opening.”
Our findings are based on a larger sample of U.S. households that participated in the February 2022 SCE Credit Access Survey, a module of the Survey of Consumer Expectations. The survey covers a nationally representative sample of 1,100 U.S. household heads, of which roughly 1,000 responded. All but 2 percent reported having a checking account at a bank or credit union. In our discussion below, we use “bank” to refer to either banks or credit unions.
Overdraft Experience
We start by summarizing respondents’ experience with overdrafts over the previous year—how often they overdrew, and by how much. Almost four-of-five (78 percent) reported zero overdrafts over the previous year (see the first chart below, including the full survey question). This finding is consistent with other surveys showing that a small fraction of depositors pays the bulk of overdraft fees. Approximately half of all overdrafts reported were for less than $50, barely more than the typical overdraft fee these days (see the second chart below).
Thinking back over the past year (twelve months), about how many times did you overdraw your account?
Percentage of respondents
{"padding":{"auto":false,"bottom":0,"left":22},"legend":{"show":false,"position":"bottom"},"axis":{"rotated":false,"x":{"show":true,"type":"category","localtime":true,"tick":{"centered":false,"culling":false,"fit":true,"outer":true,"multiline":false,"multilineMax":0},"label":{"text":"","position":"outer-center"},"categories":["0","1-3","4-6","7-10","Over 10","Don't know"]},"y":{"show":true,"inner":false,"type":"linear","inverted":false,"tick":{"centered":false,"culling":false},"padding":{"top":3,"bottom":0},"primary":"","secondary":"","label":{"text":"","position":"outer-middle"},"max":80},"y2":{"show":false,"inner":false,"type":"linear","inverted":false,"padding":{"top":3},"label":{"text":"","position":"outer-middle"}}},"chartLabel":"Percentage of respondents","color":{"pattern":["#046C9D","#D0993C","#9FA1A8","#656D76","#8FC3EA","#0D96D4","#B1812C"]},"interaction":{"enabled":true},"point":{"show":false},"data":{"groups":[],"labels":false,"type":"bar","order":"desc","selection":{"enabled":false,"grouped":true,"multiple":true,"draggable":true},"x":"","rows":[["Percentage of respondents"],["78.48"],["16.89"],["2.06"],["0.43"],["0.67"],["1.47"]]},"tooltip":{"show":true,"grouped":true},"grid":{"x":{"show":false,"lines":[],"type":"indexed","stroke":""},"y":{"show":true,"lines":[],"type":"linear","stroke":""}},"regions":[],"zoom":false,"subchart":false,"download":true,"downloadText":"Download chart","downloadName":"chart","trend":{"show":false,"label":"Trend"}}
Source: SCE Credit Access Survey, February 2022.
By how much did you typically overdraw your account (how negative was your balance on average)?
Percentage of respondents
{"padding":{"auto":false,"left":22,"right":28},"legend":{"show":false,"position":"bottom"},"axis":{"rotated":false,"x":{"show":true,"type":"category","localtime":true,"tick":{"centered":false,"culling":{"max":"0"},"fit":true,"outer":true,"multiline":false,"multilineMax":0,"rotate":21},"label":{"text":"","position":"outer-center"},"categories":["Under $10","$10 to $50","$51 to $100","$101 to $150","$151 to $200","Over $200","Don't know"]},"y":{"show":true,"inner":false,"type":"linear","inverted":false,"tick":{"centered":false,"culling":false,"count":0},"padding":{"top":3,"bottom":0},"primary":"","secondary":"","label":{"text":"","position":"outer-middle"},"max":40},"y2":{"show":false,"inner":false,"type":"linear","inverted":false,"padding":{"top":3},"label":{"text":"","position":"outer-middle"}}},"chartLabel":"Percentage of respondents","color":{"pattern":["#046C9D","#D0993C","#9FA1A8","#656D76","#8FC3EA","#0D96D4","#B1812C"]},"interaction":{"enabled":true},"point":{"show":false},"data":{"groups":[],"labels":false,"type":"bar","order":"desc","selection":{"enabled":false,"grouped":true,"multiple":true,"draggable":true},"x":"","rows":[["Percentage of respondents"],["13.39"],["35.77"],["25.94"],["5.18"],["2.75"],["5.69"],["11.29"]]},"tooltip":{"show":true,"grouped":true},"grid":{"x":{"show":false,"lines":[],"type":"indexed","stroke":""},"y":{"show":true,"lines":[],"type":"linear","stroke":""}},"regions":[],"zoom":false,"subchart":false,"download":true,"downloadText":"Download chart","downloadName":"chart","trend":{"show":false,"label":"Trend"}}
Source: SCE Credit Access Survey, February 2022.
Looking across respondents, we find that those who overdrafted more also tended to overdraw in larger amounts; the correlation was 0.36 and significantly different from zero. Overdraft fees are usually invariant to size, so this correlation implies that more frequent overdrafters receive somewhat more credit per fee.
Just 1.5 percent of respondents did not know whether they had overdrawn in the past year, and only 11 percent did not know by how much they had overdrawn. This finding suggests that the event of overdrawing, at the very least, is salient.
Expected or Accidental Overdrafts?
Are overdrafts always a surprise, or do account holders ever anticipate that a purchase will cause a negative balance? We asked respondents who overdrew in the previous year what fraction of the time they expected to do so (see chart below). The majority, 58 percent, said they never expected to overdraw, suggesting most overdrafts are accidental. We did find, however, that the fraction of expected overdrafts was significantly, positively correlated (at the 0.31 level) with overdraft frequency. This finding is in line with a recent CFPB study that found more frequent overdrafters were more likely to expect their most recent overdraft.
What percent of the time did you expect at the time of the transaction that you would be overdrawing your account?
Percentage of respondents
{"padding":{"auto":false,"left":22},"data":{"groups":[["Percentage of respondents"]],"labels":false,"type":"bar","order":"desc","selection":{"enabled":false,"grouped":true,"multiple":true,"draggable":true},"x":"","rows":[["Percentage of respondents"],["58.06"],["28.35"],["3.72"],["4.54"],["3.01"],["2.31"]]},"legend":{"show":false,"position":"bottom"},"axis":{"rotated":false,"x":{"show":true,"type":"category","localtime":true,"tick":{"centered":false,"culling":false,"fit":true,"outer":true,"multiline":false,"multilineMax":0},"label":{"text":"","position":"outer-center"},"categories":["Never","About 10%","About 25%","About 50%","About 75%","Always"]},"y":{"show":true,"inner":false,"type":"linear","inverted":false,"tick":{"centered":false,"culling":false,"values":["0","10","20","30","40","50","60"]},"padding":{"top":3,"bottom":0},"primary":"","secondary":"","label":{"text":"","position":"outer-middle"},"max":60},"y2":{"show":false,"inner":false,"type":"linear","inverted":false,"padding":{"top":3},"label":{"text":"","position":"outer-middle"}}},"chartLabel":"Percentage of respondents","color":{"pattern":["#046C9D","#D0993C","#9FA1A8","#656D76","#8FC3EA","#0D96D4","#B1812C"]},"interaction":{"enabled":true},"point":{"show":false},"tooltip":{"show":true,"grouped":true},"grid":{"x":{"show":false,"lines":[],"type":"indexed","stroke":""},"y":{"show":true,"lines":[],"type":"linear","stroke":""}},"regions":[],"zoom":false,"subchart":false,"download":true,"downloadText":"Download chart","downloadName":"chart","trend":{"show":false,"label":"Trend"}}
Source: SCE Credit Access Survey, February 2022.
Overdraft Salience
We asked several questions to assess participants’ knowledge of the overdraft terms at their banks, starting with the most basic—the fee charged. The responses are summarized in the chart below. (We excluded the roughly 10 percent of participants who reported that their bank did not allow overdrafts for a fee.) Fully half of all respondents did not know their bank’s overdraft fee, a potentially worrisome finding (see the left bar in the chart). Notably, the knowledge gap was largely driven by respondents who had not overdrawn in the previous year (see the right bar). Among respondents who experienced an overdraft, 84 percent knew their bank’s overdraft fee. This finding provides some assurance that people prone to overdrafts will know what it will cost should they overdraft again.
What is the fee per overdraft at your financial institution?
Percentage of respondents
{"padding":{"auto":false,"left":28,"right":0},"data":{"groups":[["Don't Know","> $30","$20-30","< $20"]],"labels":false,"type":"bar","order":"desc","selection":{"enabled":false,"grouped":true,"multiple":true,"draggable":true},"x":"","rows":[["Don't Know","> $30","$20-30","< $20"],["49.86223","14.7751","24.75082","10.61185"],["15.64552","","",""],["59.24647","","",""]]},"axis":{"rotated":false,"x":{"show":true,"type":"category","localtime":true,"tick":{"centered":false,"culling":false,"fit":true,"outer":true,"multiline":false,"multilineMax":0,"rotate":0},"label":{"text":"","position":"outer-center"},"categories":["All Respondents","Overdrew past year","No overdraw past year"]},"y":{"show":true,"inner":false,"type":"linear","inverted":false,"tick":{"centered":false,"culling":false},"padding":{"top":3,"bottom":0},"primary":"","secondary":"","label":{"text":"","position":"outer-middle"}},"y2":{"show":false,"inner":false,"type":"linear","inverted":false,"padding":{"top":3},"label":{"text":"","position":"outer-middle"}}},"chartLabel":"Percentage of respondents","color":{"pattern":["#046C9D","#D0993C","#9FA1A8","#656D76","#8FC3EA","#0D96D4","#B1812C"]},"interaction":{"enabled":true},"point":{"show":false},"legend":{"show":true,"position":"bottom"},"tooltip":{"show":true,"grouped":true},"grid":{"x":{"show":false,"lines":[],"type":"indexed","stroke":""},"y":{"show":true,"lines":[],"type":"linear","stroke":""}},"regions":[],"zoom":false,"subchart":false,"download":true,"downloadText":"Download chart","downloadName":"chart","trend":{"show":false,"label":"Trend"}}
Source: SCE Credit Access Survey, February 2022.
We see a similar, if less stark, pattern with overdraft limits, or the maximum overdraft that a bank allows (see chart below). Just 20 percent of respondents overall knew the limit, as compared to 39 percent of those with overdraft experience.
What is the maximum overdraft your financial institution allows (the overdraft limit)?
Percentage of respondents
{"padding":{"auto":false,"left":28},"data":{"groups":[["Don't know","< $100","$100-300","$300-500","> $500"]],"labels":false,"type":"bar","order":"desc","selection":{"enabled":false,"grouped":true,"multiple":true,"draggable":true},"x":"","rows":[["Don't know","< $100","$100-300","$300-500","> $500"],["80.34949","6.591127","4.878104","4.594382","3.586893"],["61.12633","","","",""],["85.62957","","","",""]]},"chartLabel":"Percentage of respondents","color":{"pattern":["#046C9D","#D0993C","#9FA1A8","#656D76","#8FC3EA","#0D96D4","#B1812C"]},"interaction":{"enabled":true},"point":{"show":false},"legend":{"show":true,"position":"bottom"},"tooltip":{"show":true,"grouped":true},"axis":{"rotated":false,"x":{"show":true,"type":"category","localtime":true,"tick":{"centered":false,"culling":false,"fit":true,"outer":true,"multiline":false,"multilineMax":0},"label":{"text":"","position":"outer-center"},"categories":["All Respondents","Overdrew past year","No overdraw past year"]},"y":{"show":true,"inner":false,"type":"linear","inverted":false,"tick":{"centered":false,"culling":false},"padding":{"top":3,"bottom":0},"primary":"","secondary":"","label":{"text":"","position":"outer-middle"}},"y2":{"show":false,"inner":false,"type":"linear","inverted":false,"padding":{"top":3},"label":{"text":"","position":"outer-middle"}}},"grid":{"x":{"show":false,"lines":[],"type":"indexed","stroke":""},"y":{"show":true,"lines":[],"type":"linear","stroke":""}},"regions":[],"zoom":false,"subchart":false,"download":true,"downloadText":"Download chart","downloadName":"chart","trend":{"show":false,"label":"Trend"}}
Source: SCE Credit Access Survey, February 2022.
Out-of-Order?
Some banks may clear customers’ largest transactions first, rather than in chronological order. Banks claim that reordering helps to ensure that customers’ rent or mortgage payments clear, but it can also increase the number of overdrafts.
As shown below, just 16 percent of respondents overall knew if their banks reordered transactions, and only 23 percent with overdraft experience knew. It is unclear, however, how prevalent reordering is today after a series of class-action lawsuits successfully challenged the practice.
Does your financial institution reorder transactions by clearing the largest payments first?
Percentage of respondents
{"padding":{"auto":false,"left":28},"data":{"groups":[["Don't know","No","Yes"]],"labels":false,"type":"bar","order":"desc","selection":{"enabled":false,"grouped":true,"multiple":true,"draggable":true},"x":"","rows":[["Don't know","No","Yes"],["84.42862","8.234622","7.336761"],["76.81706","",""],["86.51616","",""]]},"chartLabel":"Percentage of respondents","color":{"pattern":["#046C9D","#D0993C","#9FA1A8","#656D76","#8FC3EA","#0D96D4","#B1812C"]},"interaction":{"enabled":true},"point":{"show":false},"legend":{"show":true,"position":"bottom"},"tooltip":{"show":true,"grouped":true},"axis":{"rotated":false,"x":{"show":true,"type":"category","localtime":true,"tick":{"centered":false,"culling":false,"fit":true,"outer":true,"multiline":false,"multilineMax":0},"label":{"text":"","position":"outer-center"},"categories":["All Respondents","Overdrew past year","No overdraw past year"]},"y":{"show":true,"inner":false,"type":"linear","inverted":false,"tick":{"centered":false,"culling":false},"padding":{"top":3,"bottom":0},"primary":"","secondary":"","label":{"text":"","position":"outer-middle"}},"y2":{"show":false,"inner":false,"type":"linear","inverted":false,"padding":{"top":3},"label":{"text":"","position":"outer-middle"}}},"grid":{"x":{"show":false,"lines":[],"type":"indexed","stroke":""},"y":{"show":true,"lines":[],"type":"linear","stroke":""}},"regions":[],"zoom":false,"subchart":false,"download":true,"downloadText":"Download chart","downloadName":"chart","trend":{"show":false,"label":"Trend"}}
Source: SCE Credit Access Survey, February 2022.
Inattention
Inattention, a concept in behavioral economics, also arises in the context of overdraft credit; even if terms are salient, some depositors may not pay sufficient attention. Our survey gauged inattention by simply asking participants how much they cared about their banks’ overdraft policies. About 41 percent overall said the policies did not matter at all—in other words, the participants were indifferent (see chart below). By contrast, only about 10 percent of those with overdraft experience were indifferent.
How much do your financial institution's overdraft policies matter to you?
Percentage of respondents
{"padding":{"auto":false,"left":28},"data":{"groups":[["Not at all","Somewhat","Considerably","Extremely"]],"labels":false,"type":"bar","order":"desc","selection":{"enabled":false,"grouped":true,"multiple":true,"draggable":true},"x":"","rows":[["Not at all","Somewhat","Considerably","Extremely"],["41.02022","40.36218","9.906017","8.71158"],["10.30083","50.28953","22.38839","17.02125"],["49.44529","37.63952","6.482614","6.432577"]]},"chartLabel":"Percentage of respondents","color":{"pattern":["#046C9D","#D0993C","#9FA1A8","#656D76","#8FC3EA","#0D96D4","#B1812C"]},"interaction":{"enabled":true},"point":{"show":false},"legend":{"show":true,"position":"bottom"},"tooltip":{"show":true,"grouped":true},"axis":{"rotated":false,"x":{"show":true,"type":"category","localtime":true,"tick":{"centered":false,"culling":false,"fit":true,"outer":true,"multiline":false,"multilineMax":0},"label":{"text":"","position":"outer-center"},"categories":["All Respondents","Overdrew past year","No overdraw past year"]},"y":{"show":true,"inner":false,"type":"linear","inverted":false,"tick":{"centered":false,"culling":false},"padding":{"top":3,"bottom":0},"primary":"","secondary":"","label":{"text":"","position":"outer-middle"}},"y2":{"show":false,"inner":false,"type":"linear","inverted":false,"padding":{"top":3},"label":{"text":"","position":"outer-middle"}}},"grid":{"x":{"show":false,"lines":[],"type":"indexed","stroke":""},"y":{"show":true,"lines":[],"type":"linear","stroke":""}},"regions":[],"zoom":false,"subchart":false,"download":true,"downloadText":"Download chart","downloadName":"chart","trend":{"show":false,"label":"Trend"}}
Source: SCE Credit Access Survey, February 2022.
Summing Up
Whether overdraft policies are salient or shrouded is a key question in the debate about overdraft credit; high overdraft fees are particularly problematic if people don’t even realize they are paying them. Our findings suggest that basic aspects of overdraft are salient: people are well aware of how often they overdraw and how much it costs them. In general, we find that people with recent overdraft experience are more attentive to their institutions’ overdraft policies. However, even experienced overdrafters are unlikely to know if their bank or credit union reorders checking account transactions.

Donald P. Morgan is a financial research advisor on Banking Studies in the Federal Reserve Bank of New York’s Research and Statistics Group.

Wilbert van der Klaauw is the economic research advisor for Household and Public Policy Research in the Federal Reserve Bank of New York’s Research and Statistics Group.
How to cite this post:
Donald P. Morgan and Wilbert van der Klaauw, "Learning by Bouncing: Overdraft Experience and Salience," Federal Reserve Bank of New York Liberty Street Economics, April 1, 2024, https://libertystreeteconomics.newyorkfed.org/2024/04/learning-by-bounci....
Hold the Check: Overdrafts, Fee Caps, and Financial Inclusion

Who Pays the Price? Overdraft Fee Ceilings and the Unbanked
Disclaimer
The views expressed in this post are those of the author(s) and do not necessarily reflect the position of the Federal Reserve Bank of New York or the Federal Reserve System. Any errors or omissions are the responsibility of the author(s).
Exclusive: Unite strike fund ‘collapses’ by over two thirds amid fall in membership
Graham and team not providing official member numbers – and no finances signed off since 2021
 Birmingham bin lorries stand idle during a strike under the previous Unite leadership
Unite’s strike fund has ‘collapsed’ by more than two thirds from the level current general secretary Sharon Graham inherited from the McCluskey administration – a level that allowed strike payments of £70 a day that Graham tried to claim credit for when she took over the job. The collapse appears to be driven by fall in Unite’s membership.
At the start of Graham’s tenure, Unite had built a strike fund of £35m, able to pay striking members enough to maintain large, lengthy disputes. However, as of last week the fund had fallen to just £11m in less than three years and Unite’s recent announcement of increased membership fees is explicitly linked to the collapse.
Skwawkbox understands that there have been ‘significant’ falls in membership numbers and dues, but the union management is not disclosing an exact figure – and insiders say that no finances have been ‘signed off’ since 2021. However, the latest working figures show that Unite’s cash account has also fallen by £13m, more than ten percent.
Unite has paid out more in strike support in the last two years, but the falling member numbers and an apparent lack of planning for the replenishment of funds have left the union looking ill-prepared for future battles, with only around eight months’ worth of funds in its reserve based on the last two years’ spending.
The planned subs rise, from 1 April, of a maximum of 22p a week with many paying much less, is apparently well0 short of what would be required to maintain the strike pay outgoings of the last two years, let alone rebuild the reserve.
One senior insider told Skwawkbox that the lack of transparency and the ‘collapse’ of the fund were a serious concern and that morale is ‘rock bottom’ among union officials because of the management’s conduct, including the lack of opposition to Israel’s genocide in Gaza. Ms Graham allegedly told elected officers that ‘Palestine is not a service Unite offers members’.
SKWAWKBOX needs your help. The site is provided free of charge but depends on the support of its readers to be viable. If you’d like to help it keep revealing the news as it is and not what the Establishment wants you to hear – and can afford to without hardship – please click here to arrange a one-off or modest monthly donation via PayPal or here to set up a monthly donation via GoCardless (SKWAWKBOX will contact you to confirm the GoCardless amount). Thanks for your solidarity so SKWAWKBOX can keep doing its job.
If you wish to republish this post for non-commercial use, you are welcome to do so – see here for more.
How and Why Do Consumers Use “Buy Now, Pay Later”?
In a previous post, we highlighted that financially fragile households are disproportionately likely to use “buy now, pay later” (BNPL) payment plans. In this post, we shed further light on BNPL’s place in its users’ household finances, with a particular focus on how use varies by a household’s level of financial fragility. Our results reveal substantially different use patterns, as more-fragile households tend to use the service to make frequent, relatively small, purchases that they might have trouble affording otherwise. In contrast, financially stable households tend to not use BNPL as frequently and are more likely to emphasize that BNPL allows them to avoid paying interest on credit-finance purchases. We explore below what drives these differences and consider the implications for future BNPL use.
While the exact terms of BNPL plans can vary, they have been defined by the Office of the Comptroller of the Currency as “loans that are payable in four or fewer installments and carry no finance charges.” They are generally offered to online shoppers at checkout. BNPL plans have grown increasingly prominent in recent years, and today can be used for a wide variety of online purchases, ranging from standard retail orders to fast food deliveries. Still, because of the general lack of regulation surrounding BNPL loans, little is known about how and why households use them. To examine how BNPL use varies with a consumer’s financial situation, we draw on special questions added to the October 2023 Survey of Consumer Expectations (SCE) Credit Access Survey. The survey is fielded every four months as a rotating module of the “core” SCE, which is itself a monthly, nationally representative, internet-based survey of a rotating panel of household heads that has been conducted by the Federal Reserve Bank of New York since June 2013. Our sample consists of about 1,000 households, with about 200 reporting BNPL use.
We differentiate between two types of respondents: 1) the financially fragile, whom we define as having a credit score below 620, having been declined for a credit application in the past year, or having fallen thirty or more days delinquent on a loan in the past year, and 2) all other respondents, whom we refer to as financially stable. Our results reveal different use patterns between the two groups, with the financially fragile being more likely to use BNPL for frequent small purchases. As we discuss below, this finding contrasts with past survey evidence suggesting that BNPL use is mostly experimental, and it provides further evidence that the option is particularly attractive to those who have trouble obtaining credit otherwise. We also show that across levels of financial stability, it is rare for people to use BNPL just once. Indeed, about 72 percent of financially stable users and 89 percent of financially fragile users have made multiple BNPL purchases over the past twelve months. While we cannot determine if this relationship is causal, it is suggestive that a first use often results in repeat use, and it will be a factor to watch as more consumers try BNPL for the first time.
How Often Do Households Use BNPL?
A growing number of surveys, including our own, have shown that BNPL use is particularly likely among financially fragile individuals. Still, relatively little is known about how often households use BNPL. One exception is survey evidence presented by our colleagues at the Federal Reserve Bank of Philadelphia’s Consumer Finance Institute (CFI) suggesting that BNPL use is largely experimental, with most users not using the service as a regular payment option. That said, given that the CFI’s survey was conducted in November 2021 and that the landscape surrounding BNPL is fast changing, it is possible that many first-time users in the CFI survey have continued to use BNPL since.
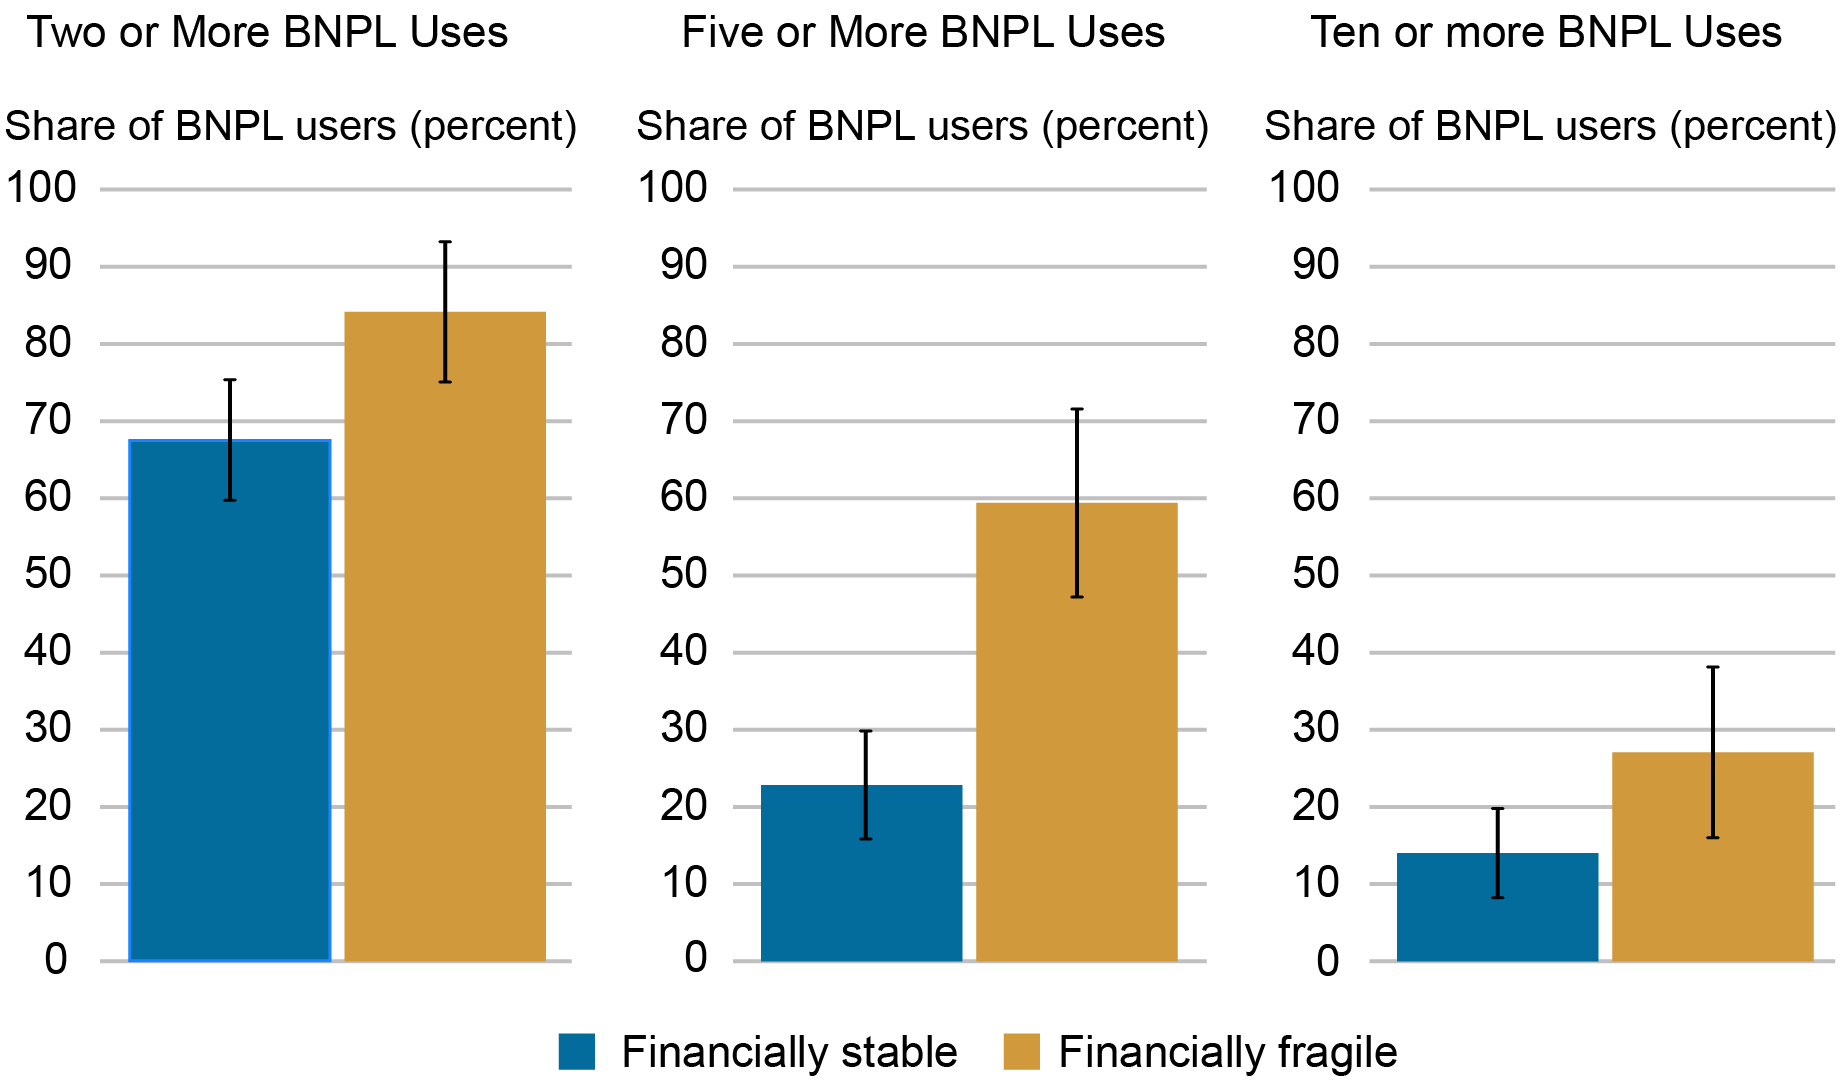
Conditional on using BNPL at least once, we asked respondents about their use frequency and average purchase sizes. Similar to our findings on which households use BNPL at all, we find that the financially fragile are disproportionately likely to use BNPL at higher frequencies and appear to have embraced BNPL as a regular payment option, as shown in the chart below. Indeed, among financially fragile BNPL users, about 60 percent have used the product five or more times in the past year, which translates to about 18 percent of all survey respondents deemed financially fragile (which includes those who have not used BNPL in the last year). This implies that financially fragile users are almost three times as likely as financially stable users to use BNPL five or more times and suggests that high-frequency use may grow if the product continues to be adopted by financially fragile households. Given that BNPL use in the U.S. has not been observed over a full business cycle, this factor will be particularly important to track, as households may turn to BNPL if their financial conditions worsen.
BNPL Use Frequency by Financial Fragility
Source: SCE Credit Access Survey.
Our results also indicate interesting aspects of financially stable households’ use patterns. While about 68 percent of financially stable BNPL users have taken advantage of the product at least twice in the past year, just 23 percent and 14 percent have used it five or more times and ten or more times, respectively. This reveals that use by the financially stable tends to drop off substantially after a few instances, but that there is a small group of financially stable individuals who use BNPL frequently.
Purchase Sizes
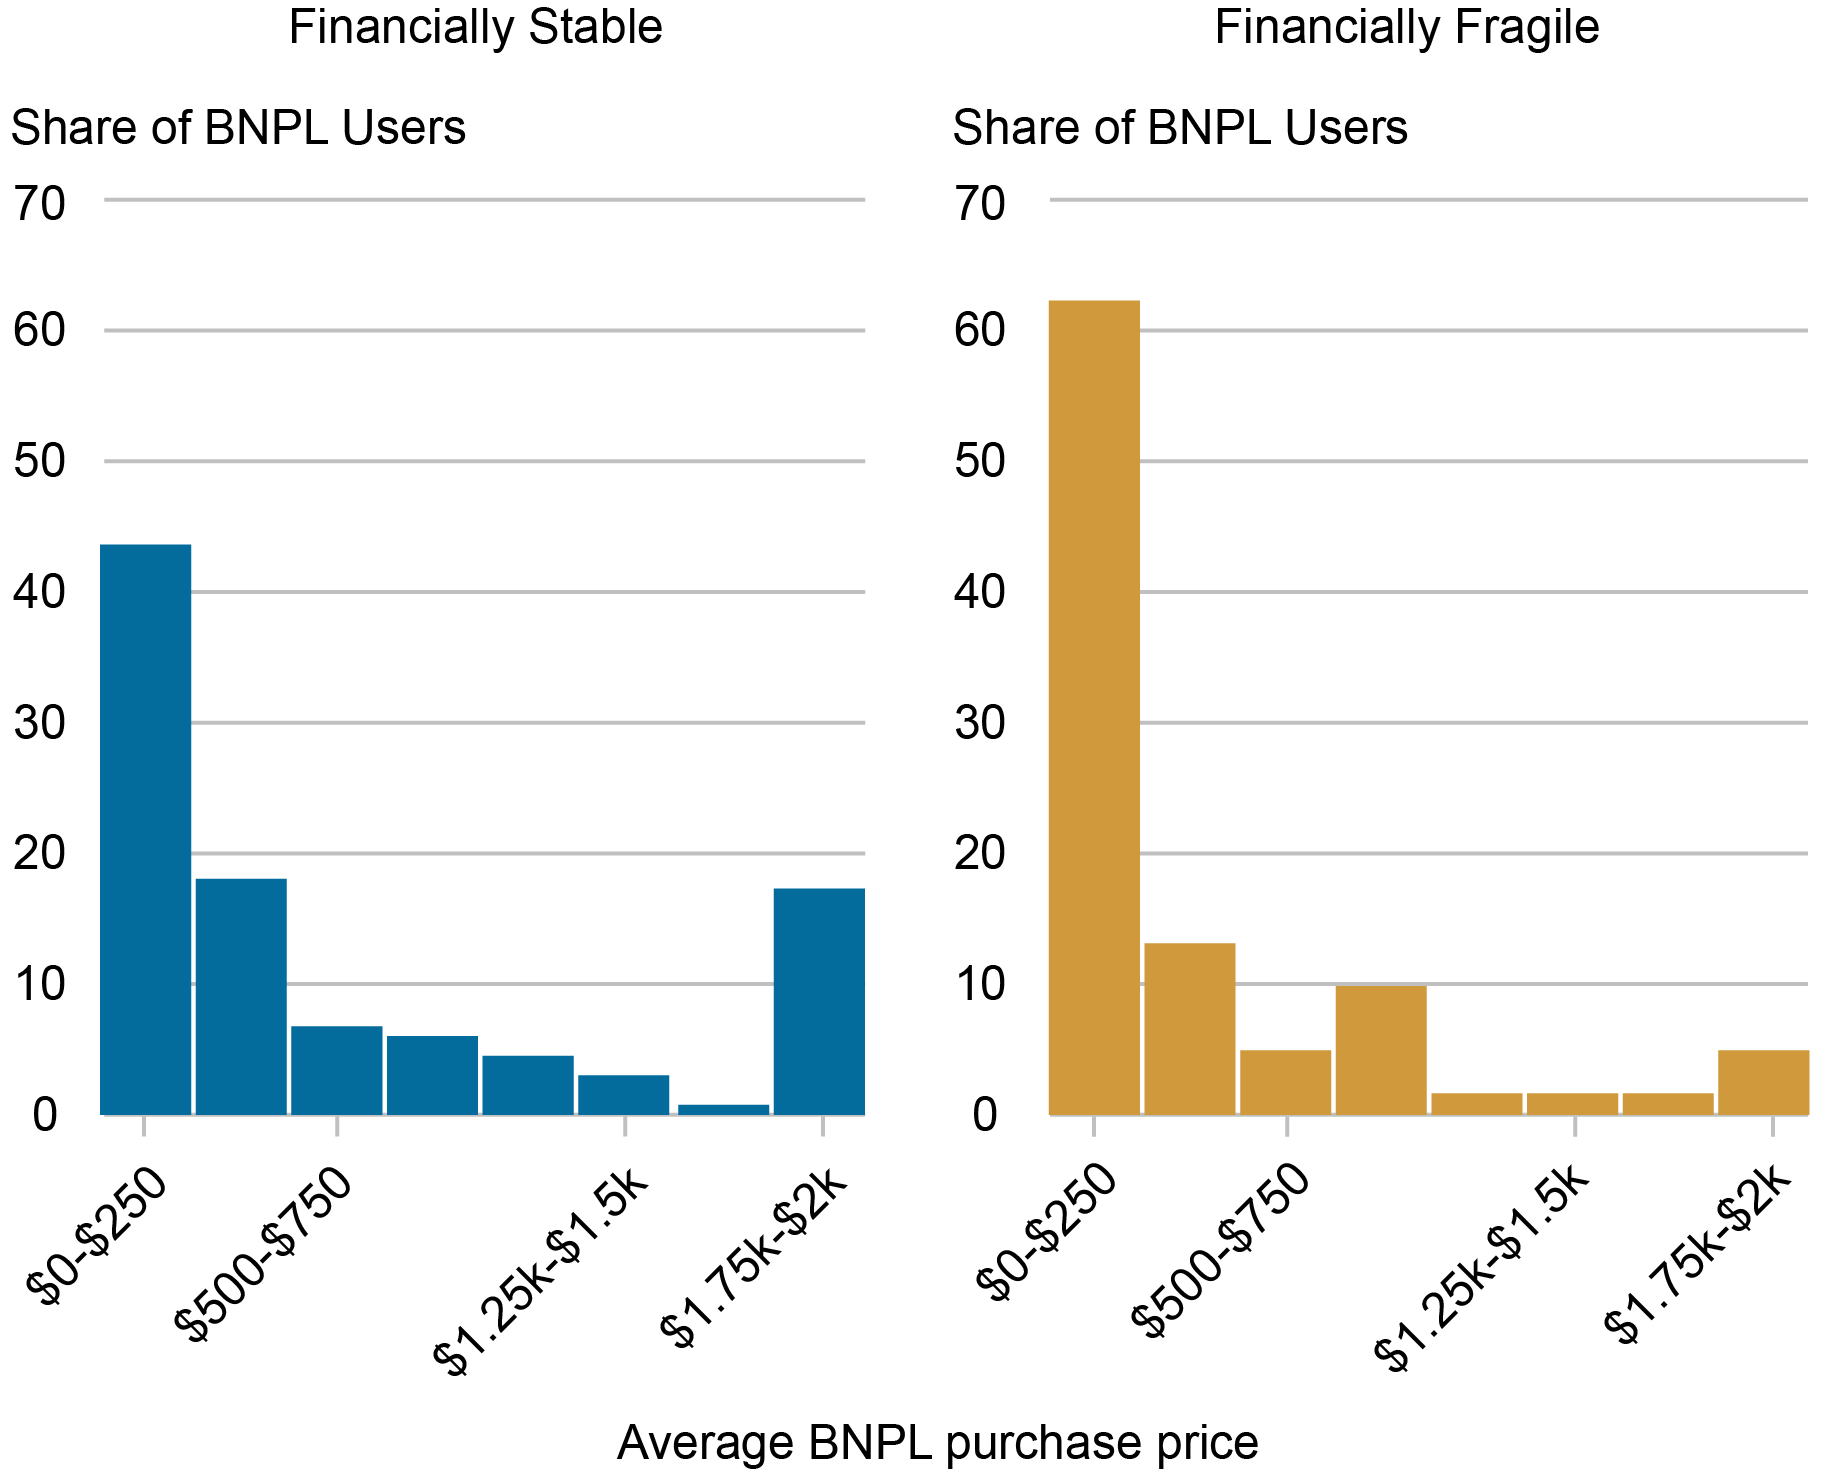
Another distinguishing factor between the two groups is the size of the purchases they make. While both groups are skewed toward relatively smaller purchases, 62 percent of financially fragile users have a mean purchase price under $250, compared to about 44 percent of the financially stable (see chart below). Looking at the rest of the distribution, this gap is largely made up in the right tail, as financially stable households are significantly more likely to have a mean purchase price between $1,750 and $2,000.
Share of BNPL Purchases by Price
Source: SCE Credit Access Survey.
Importantly, we do not find household income to be a primary driver of these disparities. Even after we control for income, financially fragile households make BNPL purchases that are on average about $220 smaller than financially stable households, and they make more purchases, averaging about four more BNPL purchases than stable household respondents in the past year.
The Anatomy of BNPL Use
To assess what’s driving these differences in use, we asked respondents an open-ended question on why they used BNPL. The word clouds below offer a visual representation of the responses of the two groups, with the size of each word indicating its frequency and prominence in answers overall.
Reasons for BNPL Use Vary by Level of Financial Stability
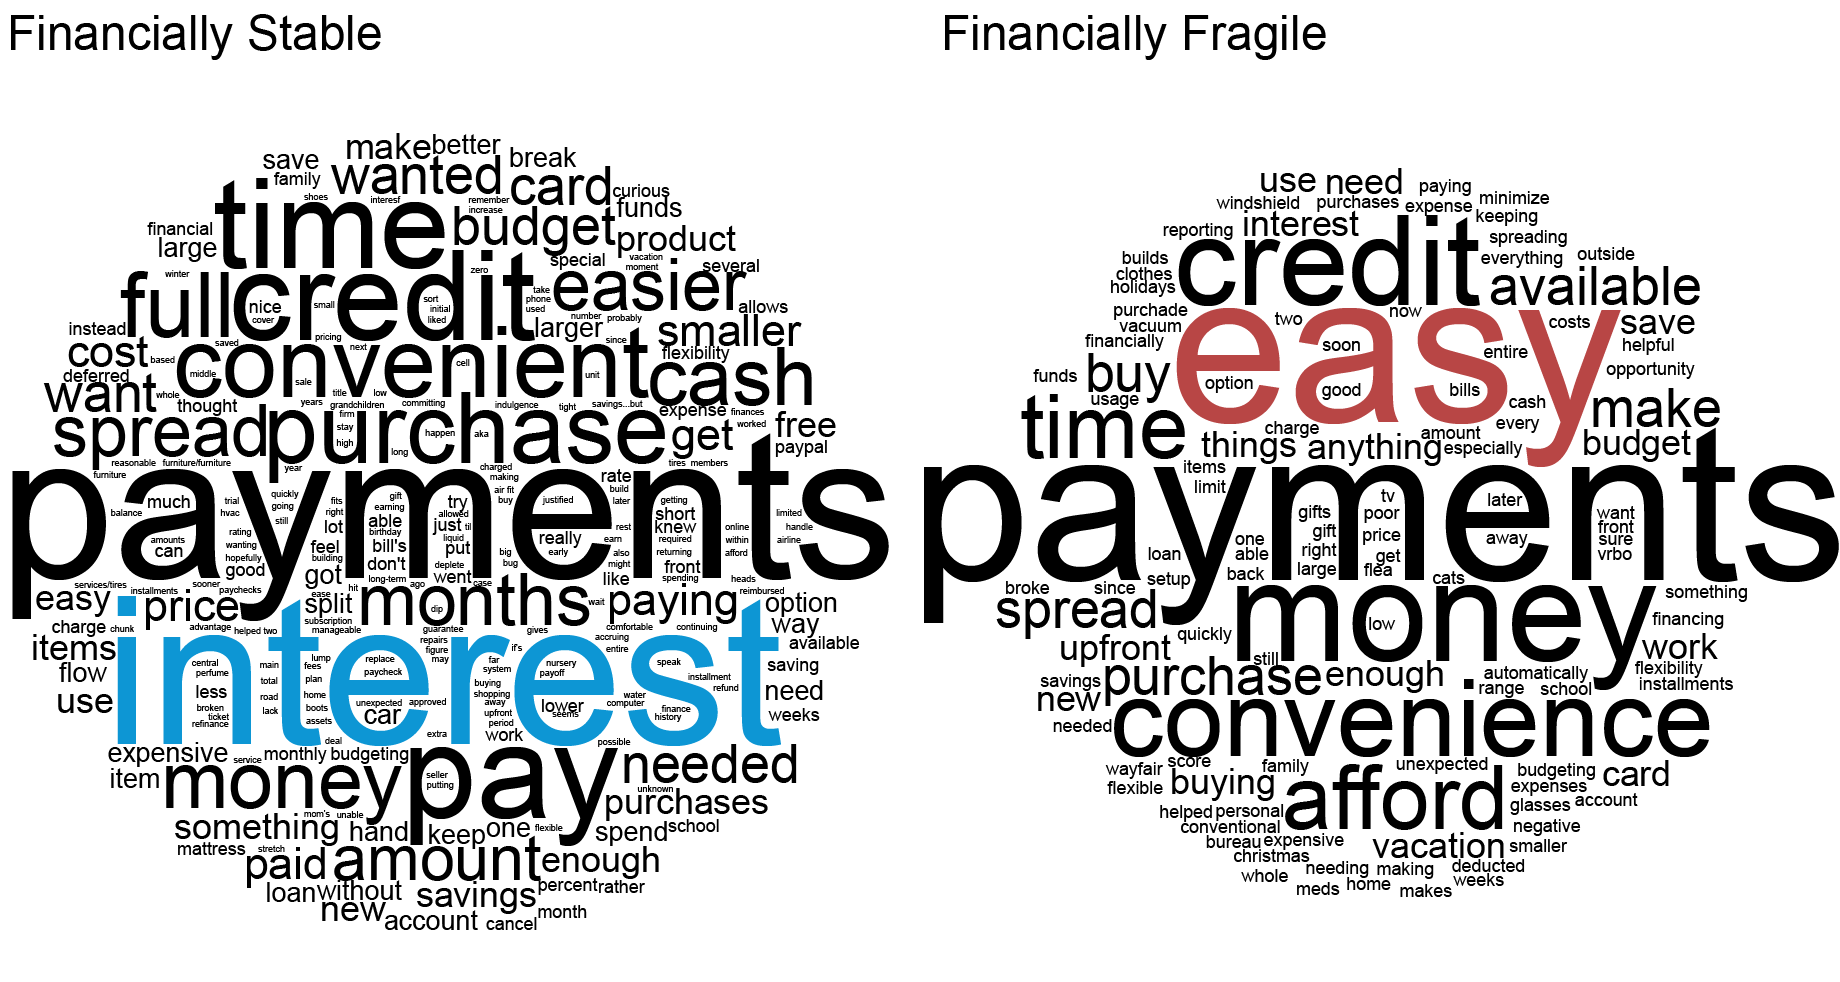
Source: SCE Credit Access Survey.
While both groups emphasize the appeal of spreading out payments, they also display key differences. The financially stable, for example, frequently mention the advantages associated with zero interest, while the financially fragile are more likely to describe ease of access and convenience. Both groups are likely to mention credit, but for different reasons. For example, the financially fragile are generally more likely to mention having poor credit, whereas the financially stable often mention that they’d like to avoid using their credit card or that they see BNPL as a good method of building credit. (Because BNPL lenders generally do not furnish data to credit bureaus, the latter statements may indicate some degree of misunderstanding among the product’s users, unless they are referring to building credit with BNPL lenders specifically.) Lastly, the financially fragile are more likely to state that they are making a purchase that they do not have money for up front or that they could otherwise not afford, while the financially stable tend not to emphasize this point.
Relating our qualitative responses to results on frequency and spending amounts, we can begin to paint a picture of differential BNPL use by financial fragility. For the financially stable, BNPL use appears to be more centered on a few purchases and seems to be largely driven by a desire to avoid paying interest on high-priced items. Meanwhile, use among the financially fragile appears to be more akin to a credit card, as shoppers use the service to make medium-size, out-of-budget purchases frequently. One primary driver of this difference could be access to short-term debt through credit cards. For individuals near their credit limit, BNPL may be particularly attractive as a way to smooth consumption over the short term. Meanwhile, those with ample credit available may choose to use BNPL for medium-size purchases as a way to avoid carrying a balance and accruing interest. That said, our results also reveal some misunderstanding of the product, even among its users, including the financially stable, given that some users seem to assume that BNPL will help them build credit, as mentioned above. Those with this view may be better off using a credit card.
Our results also have implications for future BNPL use. They suggest that the largest barrier to consumer take-up is their first use, and that after this initial use consumers tend use BNPL again. With about 80 percent of households not using BNPL in the past year, there may still be a great deal of room for increased adoption of the product. This will be particularly important to watch in the coming months, as many shoppers used BNPL for the first time this past holiday season.

Felix Aidala is a research analyst in the Federal Reserve Bank of New York’s Research and Statistics Group.

Daniel Mangrum is a research economist in Equitable Growth Studies in the Federal Reserve Bank of New York’s Research and Statistics Group.
Wilbert van der Klaauw is the economic research advisor for Household and Public Policy Research in the Federal Reserve Bank of New York’s Research and Statistics Group.
How to cite this post:
Felix Aidala, Daniel Mangrum, and Wilbert van der Klaauw, “How and Why Do Consumers Use “Buy Now, Pay Later”?,” Federal Reserve Bank of New York Liberty Street Economics, February 14, 2024, https://libertystreeteconomics.newyorkfed.org/2024/02/how-and-why-do-con....
Who Uses “Buy Now, Pay Later?”

Credit Card Delinquencies Continue to Rise—Who Is Missing Payments?

An Update on the Health of the U.S. Consumer
Disclaimer
The views expressed in this post are those of the author(s) and do not necessarily reflect the position of the Federal Reserve Bank of New York or the Federal Reserve System. Any errors or omissions are the responsibility of the author(s).
Auto Loan Delinquency Revs Up as Car Prices Stress Budgets

The New York Fed’s Center for Microeconomic Data released the Quarterly Report on Household Debt and Credit for the fourth quarter of 2023 this morning. Household debt balances grew by $212 billion over the last quarter. Although there was growth across most loan types, it was moderate compared to the fourth-quarter changes seen in the past few years. Mortgage balances grew by $112 billion and home equity line of credit (HELOC) balances saw an $11 billion bump as borrowers tapped home equity in lieu of refinancing first mortgages. Credit card balances, which typically see substantial increases in the fourth quarter coinciding with holiday spending, grew by $50 billion, and are now 14.5 percent higher than in the fourth quarter of 2022. Auto loan balances saw a $12 billion increase from the previous quarter, continuing the steady growth that has been in place since 2011. In this post, we revisit our analysis on credit cards and examine which groups are struggling with their auto loan payments. The Quarterly Report and this analysis are based on the New York Fed Consumer Credit Panel (CCP), a panel which is drawn from Equifax credit reports.
Motor vehicles saw some of the most pronounced and persistent price increases during the pandemic inflationary episode, as supply chains and chip shortages limited production. During this spell, auto loan balances ballooned. The average origination amount—that is, the borrowing amount of a car loan—had crept up slowly between 2015 and 2020 at a pace of under one percent each year, reaching about $18,000 in the first quarter of 2020. But when car prices soared in 2021 and 2022, the average amount of newly originated auto loans jumped up as well, by 11 percent through 2021 and another 10 percent in 2022. By the end of 2022, the average origination amount on auto loans was nearly $24,000. In the last year, however, both prices and average auto loan origination amounts have begun to fall. The chart below shows how average auto loan origination amounts have tracked car prices, using the Consumer Price Index (CPI) for new and used motor vehicles, in blue and red respectively, and the average origination amount, in gold.
Borrowing Amounts Loosely Track Car Price Changes
Percentage change in origination amounts since 2018:Q2
{"padding":{"auto":false,"left":25,"right":25},"data":{"groups":[],"labels":false,"type":"line","order":"desc","selection":{"enabled":false,"grouped":true,"multiple":true,"draggable":true},"xFormat":"%Y-%m-%d","x":"Date","rows":[["Date","CPI: New vehicles","CPI: Used cars and trucks","Mean origination amount for auto loans"],["2015-01-01","0","6","-4"],["2015-04-01","1","8","-9"],["2015-07-01","1","7","-2"],["2015-10-01","1","5","-3"],["2016-01-01","1","4","-1"],["2016-04-01","1","5","-8"],["2016-07-01","1","4","-1"],["2016-10-01","1","2","4"],["2017-01-01","2","1","1"],["2017-04-01","1","0","-3"],["2017-07-01","0","-1","1"],["2017-10-01","0","0","3"],["2018-01-01","1","0","2"],["2018-04-01","0","0","0"],["2018-07-01","0","0","3"],["2018-10-01","0","1","7"],["2019-01-01","2","1","5"],["2019-04-01","1","1","6"],["2019-07-01","0","2","9"],["2019-10-01","0","1","6"],["2020-01-01","2","0","12"],["2020-04-01","1","-1","12"],["2020-07-01","1","6","3"],["2020-10-01","2","12","20"],["2021-01-01","3","10","21"],["2021-04-01","4","31","25"],["2021-07-01","8","40","33"],["2021-10-01","13","48","37"],["2022-01-01","16","53","44"],["2022-04-01","17","50","47"],["2022-07-01","19","50","49"],["2022-10-01","21","43","32"],["2023-01-01","23","35","43"],["2023-04-01","23","42","40"],["2023-07-01","23","40","42"],["2023-10-01","23","37","40"]]},"axis":{"rotated":false,"x":{"show":true,"type":"timeseries","localtime":true,"tick":{"centered":false,"culling":{"max":"0"},"fit":true,"outer":true,"multiline":false,"multilineMax":0,"rotate":0,"format":"%Y:$QQ","values":["2015-01-01","2021-01-01","2017-01-01","2019-01-01","2023-01-01"]},"label":{"text":"","position":"outer-center"},"format":"%Y-%m-%d"},"y":{"show":true,"inner":false,"type":"linear","inverted":false,"tick":{"centered":false,"culling":false},"padding":{"top":3,"bottom":0},"primary":"","secondary":"","label":{"text":"","position":"outer-middle"},"max":60,"min":-10},"y2":{"show":false,"inner":false,"type":"linear","inverted":false,"padding":{"top":3},"label":{"text":"","position":"outer-middle"}}},"chartLabel":"Percentage change in origination amounts since 2018:Q2","color":{"pattern":["#61AEE1","#B84645","#B1812C","#046C9D","#9FA1A8","#DCB56E"]},"interaction":{"enabled":true},"point":{"show":false},"legend":{"show":true,"position":"bottom"},"tooltip":{"show":true,"grouped":true},"grid":{"x":{"show":false,"lines":[],"type":"indexed","stroke":""},"y":{"show":true,"lines":[],"type":"linear","stroke":""}},"regions":[],"zoom":false,"subchart":false,"download":true,"downloadText":"Download chart","downloadName":"chart","trend":{"show":false,"label":"Trend"}}
Sources: New York Fed Consumer Credit Panel/Equifax; Bureau of Labor Statistics.
Note: CPI is Consumer Price Index.
Household debt delinquencies reached historic lows during the pandemic period, thanks to forbearances on mortgages and federal student loans and stimulus payments. But as forbearances ended and the savings from stimulus payments were exhausted for many households, delinquency rates have been rising again, for all types of debt. The chart below shows the percentage of auto balances newly transitioning to delinquency. Both auto loans and credit cards have seen particular worsening of new delinquencies, with transition rates now above pre-pandemic levels. [Note that the subsequent analysis uses a loan-level data set drawn from the Consumer Credit Panel by the Philadelphia Fed. While similar to the individual-level data used for the Quarterly Report, this alternative loan-level data permits finer analysis by vintage and loan origination amount. Due to some different inclusion criteria, aggregates from tradeline data may differ slightly from those in the Quarterly Report.]
Auto Loan Delinquency Transition Rates Surpass Pre-Pandemic Levels
Percent of balances transitioning into delinquency
{"padding":{"auto":false,"right":25,"left":25},"data":{"groups":[],"labels":false,"type":"line","order":"desc","selection":{"enabled":false,"grouped":true,"multiple":true,"draggable":true},"x":"Date","xFormat":"%Y-%m-%d","rows":[["Date","Delinquency"],["2017-06-01","2.01"],["2017-09-01","2.01"],["2017-12-01","1.89"],["2018-03-01","1.55"],["2018-06-01","1.88"],["2018-09-01","1.93"],["2018-12-01","1.93"],["2019-03-01","1.55"],["2019-06-01","1.75"],["2019-09-01","1.96"],["2019-12-01","1.87"],["2020-03-01","1.48"],["2020-06-01","1.13"],["2020-09-01","1.46"],["2020-12-01","1.56"],["2021-03-01","1.21"],["2021-06-01","1.09"],["2021-09-01","1.38"],["2021-12-01","1.50"],["2022-03-01","1.36"],["2022-06-01","1.59"],["2022-09-01","1.92"],["2022-12-01","1.91"],["2023-03-01","1.62"],["2023-06-01","2.02"],["2023-09-01","2.05"],["2023-12-01","2.24"]]},"legend":{"show":false,"position":"bottom"},"axis":{"rotated":false,"x":{"show":true,"type":"timeseries","localtime":true,"tick":{"centered":false,"culling":false,"fit":true,"outer":true,"multiline":false,"multilineMax":0,"format":"%Y:$QQ","values":["2019-01-01","2021-01-01","2023-01-01","2018-01-01","2020-01-01","2022-01-01"]},"label":{"text":"","position":"outer-center"},"format":"%Y-%m-%d"},"y":{"show":true,"inner":false,"type":"linear","inverted":false,"tick":{"centered":false,"culling":false,"values":["3.0","2.5","2.0","1.5","1.0","0","0.5"]},"padding":{"top":3,"bottom":0},"primary":"","secondary":"","label":{"text":"","position":"outer-middle"},"max":3,"min":0},"y2":{"show":false,"inner":false,"type":"linear","inverted":false,"padding":{"top":3},"label":{"text":"","position":"outer-middle"}}},"chartLabel":"Percent of balances transitioning into delinquency","color":{"pattern":["#61AEE1","#B84645","#B1812C","#046C9D","#9FA1A8","#DCB56E"]},"interaction":{"enabled":true},"point":{"show":false},"tooltip":{"show":true,"grouped":true},"grid":{"x":{"show":false,"lines":[],"type":"indexed","stroke":""},"y":{"show":true,"lines":[],"type":"linear","stroke":""}},"regions":[],"zoom":false,"subchart":false,"download":true,"downloadText":"Download chart","downloadName":"chart","trend":{"show":false,"label":"Trend"}}
Source: New York Fed Consumer Credit Panel/Equifax, using Philadelphia Fed auto loan tradeline data.
Note: The chart shows transition rates into 30-day delinquency and rates are balance-weighted.
Who Is Driving Up Delinquencies?
We now look at delinquency rates by various borrower traits. In the next chart, we examine delinquency by birth generation. Delinquency tends to decrease with age, and younger generations have delinquency rates slightly higher than their predecessors. In our recent post on credit cards, we saw that Millennials (born 1980-1994) have seen delinquency rates worsening more quickly than other generations. For auto loans, this appears to be the case as well, although the disparities here are less pronounced. All generations have delinquency transition rates that have been rising sharply over the past two years, with those for Millennials and Baby Boomers (born 1946-64) now being above their pre-pandemic levels. Note that the data in the next two charts, unlike the previous chart, is annualized using four-quarter moving sums to account for seasonal trends.
Delinquency Transition Rates for Baby Boomers and Millennials Are Now above Pre-Pandemic Levels
Percent of balances transitioning into delinquency
{"padding":{"auto":false,"right":18,"left":23},"data":{"groups":[],"labels":false,"type":"line","order":"desc","selection":{"enabled":false,"grouped":true,"multiple":true,"draggable":true},"x":"Date","rows":[["Date","Baby Boomers","Generation X","Millennials","Generation Z"],["2018-03-01","5.17","7.93","9.26","13.28"],["2018-06-01","4.85","7.70","9.42","13.02"],["2018-09-01","4.65","7.61","9.33","13.08"],["2018-12-01","4.66","7.69","9.28","13.19"],["2019-03-01","4.53","7.79","9.20","13.28"],["2019-06-01","4.54","7.48","8.94","13.07"],["2019-09-01","4.53","7.52","8.91","12.83"],["2019-12-01","4.50","7.34","8.90","12.32"],["2020-03-01","4.49","7.15","8.91","12.00"],["2020-06-01","4.08","6.59","8.09","10.37"],["2020-09-01","3.87","5.90","7.49","9.39"],["2020-12-01","3.76","5.49","7.11","8.90"],["2021-03-01","3.68","5.17","6.67","8.26"],["2021-06-01","3.68","4.89","6.81","8.20"],["2021-09-01","3.60","4.76","6.63","8.49"],["2021-12-01","3.43","4.64","6.53","8.53"],["2022-03-01","3.37","4.62","6.83","9.21"],["2022-06-01","3.66","5.14","7.26","10.11"],["2022-09-01","3.74","5.62","8.15","10.30"],["2022-12-01","3.92","5.93","8.61","10.98"],["2023-03-01","4.08","6.23","8.85","10.80"],["2023-06-01","4.32","6.60","9.39","11.04"],["2023-09-01","4.57","6.73","9.27","11.35"],["2023-12-01","4.78","7.01","9.56","11.86"]]},"axis":{"rotated":false,"x":{"show":true,"type":"timeseries","localtime":true,"tick":{"centered":false,"culling":false,"fit":true,"outer":true,"multiline":false,"multilineMax":0,"format":"%Y:$QQ","values":["2019-01-01","2020-01-01","2021-01-01","2022-01-01","2023-01-01"]},"label":{"text":"","position":"outer-center"},"format":"%Y-%m-%d"},"y":{"show":true,"inner":false,"type":"linear","inverted":false,"tick":{"centered":false,"culling":false},"padding":{"top":3,"bottom":0},"primary":"","secondary":"","label":{"text":"","position":"outer-middle"},"max":14,"min":0},"y2":{"show":false,"inner":false,"type":"linear","inverted":false,"padding":{"top":3},"label":{"text":"","position":"outer-middle"}}},"chartLabel":"Percent of balances transitioning into delinquency","color":{"pattern":["#61AEE1","#B84645","#B1812C","#046C9D","#9FA1A8","#DCB56E"]},"interaction":{"enabled":true},"point":{"show":false},"legend":{"show":true,"position":"bottom"},"tooltip":{"show":true,"grouped":true},"grid":{"x":{"show":false,"lines":[],"type":"indexed","stroke":""},"y":{"show":true,"lines":[],"type":"linear","stroke":""}},"regions":[],"zoom":false,"subchart":false,"download":true,"downloadText":"Download chart","downloadName":"chart","trend":{"show":false,"label":"Trend"}}
Source: New York Fed Consumer Credit Panel / Equifax, using Philadelphia Fed auto loan tradeline data.
Notes: The chart shows transition rates into 30-day delinquency and rates are balance-weighted. Data are annualized as four-quarter moving sums to account for seasonal trends. Borrowers are grouped by generation using their birth year. Baby Boomers are those born between 1946 and 1964, Generation X are 1965 to 1979, Millennials are 1980 to 1994, and Generation Z are 1995 to 2011.
Next, we show how auto loan delinquency has evolved by zip code average income, as measured by average adjusted gross income from the Internal Revenue Service (IRS) Statistics of Income. While all income areas now have delinquency rates slightly above the pre-pandemic level, this rise is the most pronounced for borrowers in the lowest-income areas, shown on the light blue line.
Delinquencies Rise Most for Borrowers in Low-Income Areas
Percent of balances transitioning into delinquency
{"padding":{"auto":false,"right":18,"left":23},"data":{"groups":[],"labels":false,"type":"line","order":"desc","selection":{"enabled":false,"grouped":true,"multiple":true,"draggable":true},"x":"Date","rows":[["Date","1 (lowest income)","2","3","4 (highest income)"],["2018-03-01","11.66","8.53","6.45","4.18"],["2018-06-01","11.61","8.18","6.45","4.12"],["2018-09-01","11.22","8.15","6.28","4.18"],["2018-12-01","11.53","7.99","6.32","4.22"],["2019-03-01","11.65","7.90","6.25","4.31"],["2019-06-01","11.57","7.78","6.02","4.26"],["2019-09-01","11.81","7.80","6.02","4.15"],["2019-12-01","11.40","7.99","5.88","4.19"],["2020-03-01","11.32","7.93","5.92","4.01"],["2020-06-01","10.32","7.14","5.32","3.76"],["2020-09-01","9.45","6.60","5.00","3.48"],["2020-12-01","9.06","6.12","4.81","3.28"],["2021-03-01","8.47","5.71","4.62","3.25"],["2021-06-01","8.35","5.65","4.68","3.25"],["2021-09-01","8.33","5.44","4.57","3.22"],["2021-12-01","8.32","5.35","4.46","3.11"],["2022-03-01","8.79","5.42","4.63","3.11"],["2022-06-01","9.85","5.98","4.99","3.26"],["2022-09-01","10.73","6.65","5.44","3.45"],["2022-12-01","11.22","7.06","5.86","3.79"],["2023-03-01","11.52","7.46","5.90","4.06"],["2023-06-01","12.06","8.05","6.21","4.27"],["2023-09-01","12.37","8.19","6.17","4.43"],["2023-12-01","12.85","8.64","6.39","4.58"]]},"axis":{"rotated":false,"x":{"show":true,"type":"timeseries","localtime":true,"tick":{"centered":false,"culling":false,"fit":true,"outer":true,"multiline":false,"multilineMax":0,"format":"%Y:$QQ","values":["2018-03-01","2019-03-01","2020-03-01","2021-03-01","2022-03-01","2023-03-01"]},"label":{"text":"","position":"outer-center"},"format":"%Y-%m-%d"},"y":{"show":true,"inner":false,"type":"linear","inverted":false,"tick":{"centered":false,"culling":false},"padding":{"top":3,"bottom":0},"primary":"","secondary":"","label":{"text":"","position":"outer-middle"},"max":14,"min":0},"y2":{"show":false,"inner":false,"type":"linear","inverted":false,"padding":{"top":3},"label":{"text":"","position":"outer-middle"}}},"chartLabel":"Percent of balances transitioning into delinquency","color":{"pattern":["#61AEE1","#B84645","#B1812C","#046C9D","#9FA1A8","#DCB56E"]},"interaction":{"enabled":true},"point":{"show":false},"legend":{"show":true,"position":"bottom"},"tooltip":{"show":true,"grouped":true},"grid":{"x":{"show":false,"lines":[],"type":"indexed","stroke":""},"y":{"show":true,"lines":[],"type":"linear","stroke":""}},"regions":[],"zoom":false,"subchart":false,"download":true,"downloadText":"Download chart","downloadName":"chart","trend":{"show":false,"label":"Trend"}}
Sources: New York Fed Consumer Credit Panel/Equifax; IRS Statistics of Income.
Notes: The chart shows transition rates into 30-day delinquency and rates are balance-weighted. Data are annualized as four-quarter moving sums to account for seasonal trends. Borrowers are categorized into income quartiles by ranking zip code average income from lowest to highest and splitting zip codes into four equally sized groups by population.
The chart below shows average monthly payment amounts for new auto loans opened in that quarter, separated by zip code income. Interestingly, average monthly payments are very similar across income areas in nominal terms except for the highest-income quartile. All areas saw similar, sharp increases in payments on auto loans originated since 2019:Q4. However, the increase in monthly payments on loans newly opened in the lowest-income quartile would impose a much greater burden as a share of income than that faced by the highest-income group. The trend for origination amounts by area income (not shown) is similar to the trend for average payments. However, we note that the decline in the average origination balance in recent quarters, shown in the first chart, is not being passed through to the average scheduled payments. This diverging pattern between origination amount and the monthly payment over the last year can be explained by the increase in interest rates on auto loans.
Payments on Newly Opened Auto Loans Climb Sharply
Average monthly payment (in U.S. dollars)
{"padding":{"auto":false,"right":18,"left":32,"bottom":0},"data":{"groups":[],"labels":false,"type":"line","order":"desc","selection":{"enabled":false,"grouped":true,"multiple":true,"draggable":true},"x":"Date","rows":[["Date","1 (lowest income)","2","3","4 (highest income)"],["2017-03-01","407","397","401","445"],["2017-06-01","396","388","397","440"],["2017-09-01","405","392","399","448"],["2017-12-01","418","405","407","443"],["2018-03-01","401","417","409","443"],["2018-06-01","403","394","413","435"],["2018-09-01","419","403","407","452"],["2018-12-01","431","422","429","472"],["2019-03-01","434","421","423","477"],["2019-06-01","434","421","419","463"],["2019-09-01","434","419","422","464"],["2019-12-01","436","417","437","462"],["2020-03-01","438","420","432","470"],["2020-06-01","434","436","421","463"],["2020-09-01","425","414","435","458"],["2020-12-01","447","438","441","471"],["2021-03-01","445","437","459","500"],["2021-06-01","441","458","456","520"],["2021-09-01","488","468","481","519"],["2021-12-01","510","484","500","557"],["2022-03-01","519","498","503","574"],["2022-06-01","534","503","518","558"],["2022-09-01","527","520","526","599"],["2022-12-01","542","534","555","615"],["2023-03-01","542","527","533","620"],["2023-06-01","541","521","541","616"],["2023-09-01","560","536","555","603"],["2023-12-01","564","545","562","623"]]},"axis":{"rotated":false,"x":{"show":true,"type":"timeseries","localtime":true,"tick":{"centered":false,"culling":false,"fit":true,"outer":true,"multiline":false,"multilineMax":0,"format":"%Y:$QQ","values":["2018-01-01","2019-01-01","2020-01-01","2021-01-01","2022-01-01","2023-01-01"]},"label":{"text":"","position":"outer-center"},"format":"%Y-%m-%d"},"y":{"show":true,"inner":false,"type":"linear","inverted":false,"tick":{"centered":false,"culling":false,"values":["650","600","550","500","450","400","350"]},"padding":{"top":3,"bottom":0},"primary":"","secondary":"","label":{"text":"","position":"outer-middle"},"max":650,"min":350},"y2":{"show":false,"inner":false,"type":"linear","inverted":false,"padding":{"top":3},"label":{"text":"","position":"outer-middle"}}},"chartLabel":"Average monthly payment (in U.S. dollars)","color":{"pattern":["#61AEE1","#B84645","#B1812C","#046C9D","#9FA1A8","#DCB56E"]},"interaction":{"enabled":true},"point":{"show":false},"legend":{"show":true,"position":"bottom"},"tooltip":{"show":true,"grouped":true},"grid":{"x":{"show":false,"lines":[],"type":"indexed","stroke":""},"y":{"show":true,"lines":[],"type":"linear","stroke":""}},"regions":[],"zoom":false,"subchart":false,"download":true,"downloadText":"Download chart","downloadName":"chart","trend":{"show":false,"label":"Trend"}}
Sources: New York Fed Consumer Credit Panel/Equifax; IRS Statistics of Income.
Note: Borrowers are categorized into income quartiles by ranking zip code average income from lowest to highest and splitting zip codes into four equally sized groups by population.
Conclusion
With the pandemic policy supports in the rear-view mirror, delinquency rates for most credit types have been rising after having reached very low levels during 2021. Concentrating on auto loans, delinquency transition rates have pushed past pre-pandemic levels, and the worsening appears to be broad-based. Loans opened during 2022 and 2023 are, so far, performing worse than loans opened in earlier years, perhaps because buyers during these years faced higher car prices and may have been pressed to borrow more, and at higher interest rates. The increasing transition rates merit monitoring in the months ahead, particularly with the amplified distress shown by borrowers in lower-income areas.

Andrew F. Haughwout is the director of Household and Public Policy Research in the Federal Reserve Bank of New York’s Research and Statistics Group.

Donghoon Lee is an economic research advisor in Consumer Behavior Studies in the Federal Reserve Bank of New York’s Research and Statistics Group.
Daniel Mangrum is a research economist in Equitable Growth Studies in the Federal Reserve Bank of New York’s Research and Statistics Group.

Joelle Scally is a regional economic principal in the Federal Reserve Bank of New York’s Research and Statistics Group.
Wilbert van der Klaauw is the economic research advisor for Household and Public Policy Research in the Federal Reserve Bank of New York’s Research and Statistics Group.

Crystal Wang is a research analyst in the Federal Reserve Bank of New York’s Research and Statistics Group.
How to cite this post:
Andrew Haughwout, Donghoon Lee, Daniel Mangrum, Joelle Scally, Wilbert van der Klaauw, and Crystal Wang, “Auto Loan Delinquency Revs Up as Car Prices Stress Budgets,” Federal Reserve Bank of New York Liberty Street Economics, February 6, 2024, https://libertystreeteconomics.newyorkfed.org/2024/02/auto-loan-delinque....
Credit Card Delinquencies Continue to Rise—Who Is Missing Payments?
Borrower Expectations for the Return of Student Loan Repayment
Where Is Inflation Persistence Coming From?
Interactive Charts: Household Debt and Credit
Disclaimer
The views expressed in this post are those of the author(s) and do not necessarily reflect the position of the Federal Reserve Bank of New York or the Federal Reserve System. Any errors or omissions are the responsibility of the author(s).
How Do Banks Lend in Inaccurate Flood Zones in the Fed’s Second District?

In our previous post, we identified the degree to which flood maps in the Federal Reserve’s Second District are inaccurate. In this post, we use our data on the accuracy of flood maps to examine how banks lend in “inaccurately mapped” areas, again focusing on the Second District in particular. We find that banks are seemingly aware of poor-quality flood maps and are generally less likely to lend in such regions, thereby demonstrating a degree of flood risk management or risk aversion. This propensity to avoid lending in inaccurately mapped areas can be seen in jumbo as well as non-jumbo loans, once we account for a series of confounding effects. The results for the Second District largely mirror those for the rest of the nation, with inaccuracies leading to similar reductions in lending, especially among non-jumbo loans.
Inaccurate Flood Maps
As manager of the National Flood Insurance Program (NFIP), the Federal Emergency Management Agency (FEMA) works with communities to draw maps that denote the risk of a catastrophic flood occurring at least once in 100 years. Areas that are at risk of such flooding are considered to have a 1 percent (or more) annual flood risk. An important implication of being in a flood zone is the insurance requirement for mortgage borrowers. Specifically, any mortgage applicant in a flood zone whose mortgage meets certain criteria—such as being eligible for securitization or being made by a financial institution—must buy flood insurance. The program—as well as the implications for the mortgage market—are discussed in previous Liberty Street Economics posts in this series (see here or here).
In our previous post, we discussed the fact that certain flood maps may be inaccurate. These inaccuracies arise partly because it takes time to update the maps in the face of climate change, and partly because of improvements and other changes made to local infrastructure and building materials that take time to be reflected in official flood maps. We use property-level information on flood damage exposure from CoreLogic as well as digitized flood maps for 2022 to define inaccuracies (as described in our previous post).
Maps can be inaccurate in one of two ways: either they designate too much of an area as being a “flood risk,” or they designate too little. For the purposes of this post, we focus only on the latter issue and define two categories of inaccuracy. If a property faces significant flooding damage (highest damage quartile) but is not “mapped” into a flood zone, its map is “very inaccurate.” If a property faces moderate damage but is not covered by a flood zone, its map is simply “inaccurate.” All other properties are either accurately mapped or correctly excluded from a flood map because they face no flood risk. We collapse this data at the census-tract level and then calculate the share of each census tract that is “very inaccurate” and “inaccurate” in the analyses below. This somewhat coarse analysis is necessary as we cannot use address-specific mortgage data. As before, we focus on properties in the Second District as well as the nation as a whole for mortgage applications in 2019 and 2020.
A key question is whether lenders are aware of—and responsive to—these inaccuracies. To this end, we make use of Home Mortgage Disclosure Act (HMDA) mortgage data at the census tract level. We first look at simple correlations between the share of a census tract that is “very inaccurate” and the acceptance rate of loan applications. In the left panel of the chart below, we see that for non-jumbo (“conforming”) loans, there is very little relationship between the two variables. This is possibly a consequence of many of these loans moving off of a bank’s balance sheet in the near term. However, jumbo loans, which are more likely to be retained by banks, show a much more negative correlation, as shown in the right panel. In other words, census tracts in which a greater proportion of homes are inaccurately mapped see a lower acceptance rate for jumbo applications, on average.
Lending in Areas with Inaccurate Flood Maps
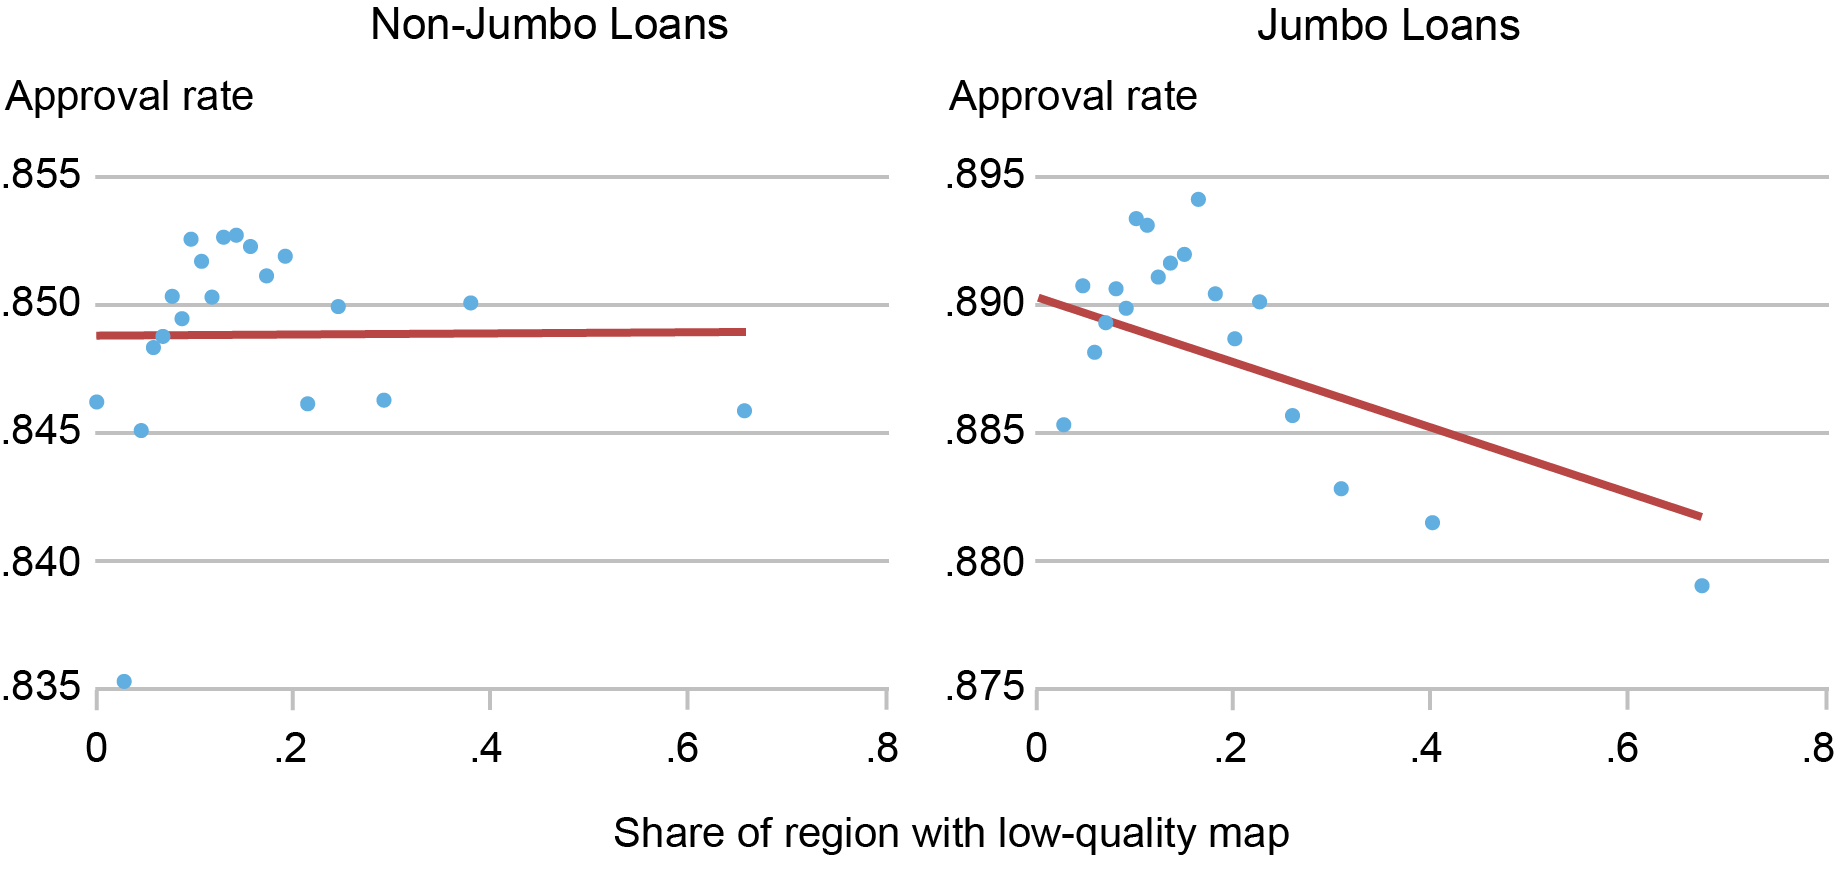
Sources: Authors’ calculations; Federal Emergency Management Agency (FEMA); Home Mortgage Disclosure Act (HMDA) data; CoreLogic.
Notes: This chart shows binscatter plots that relate the share of a census tract that is “very inaccurately” mapped to the loan acceptance rate. It includes time controls but no other adjustments. Data cover the Second District excluding Puerto Rico and the U.S. Virgin Islands and are split into conforming (non-jumbo) and non-conforming (jumbo) loans.
This result is possibly a reflection of bank risk management. Retaining a loan that is subject to flood risk but that may not have flood insurance (or may even be ineligible for insurance from the NFIP if the community does not participate) may represent too risky a proposition. However, since a whole host of other factors go into a mortgage application decision, we use regression analysis to control for these other factors.
The Effect of Flood Map Accuracy on Lending
Our outcome variable is the loan acceptance probability as measured by a variable that takes the value of “1” if an application is accepted. We regress the loan acceptance probability on application amounts in dollars, borrower characteristics (income, gender, race, and loan-to-income ratio), the county where the property is located interacted with time, the average census tract income, past flood damages, and a host of other characteristics. We also include a variable that denotes the share of properties in a census tract that are (1) “inaccurately mapped” or (2) “very inaccurately mapped.” Results are shown in the chart below.
Effect of Inaccurate Maps, after Accounting for Borrower and Region Characteristics
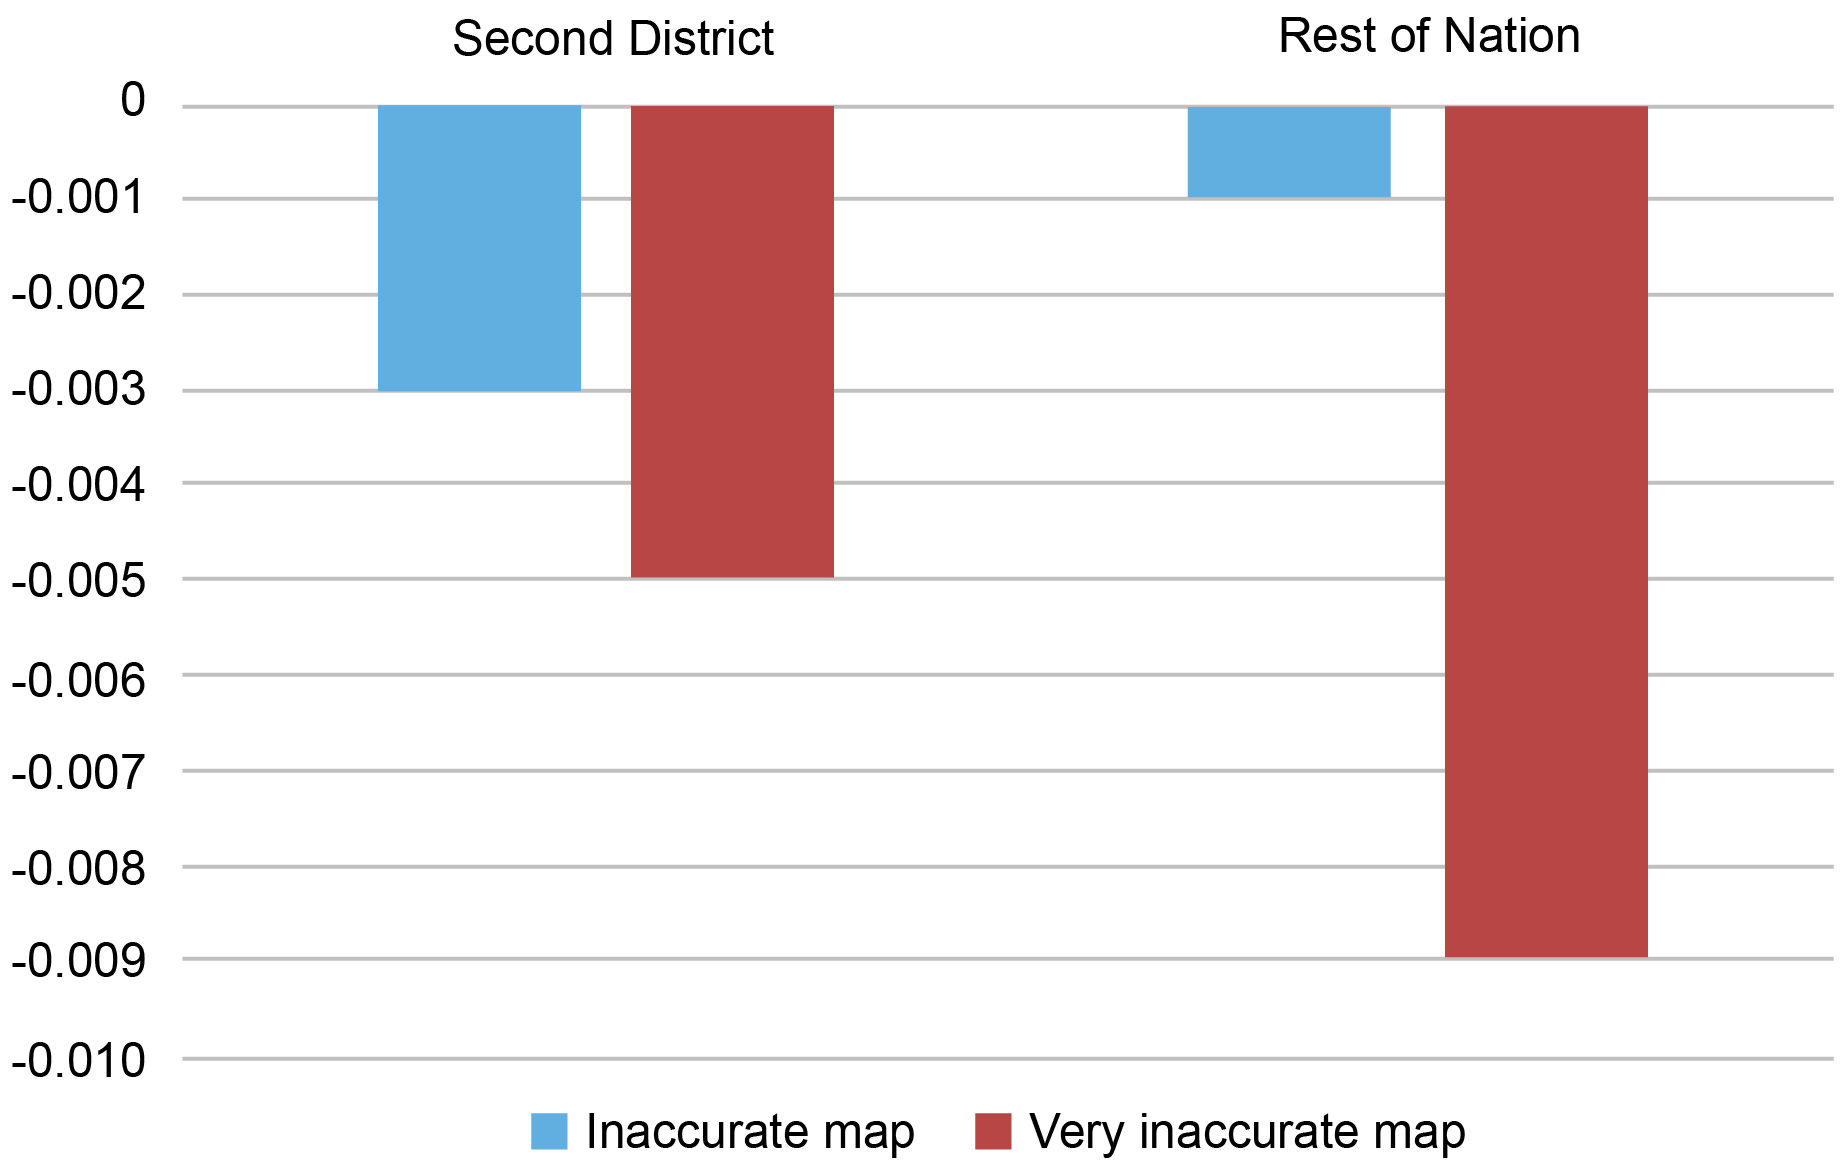
Sources: Authors’ calculations; Federal Emergency Management Agency (FEMA); Home Mortgage Disclosure Act (HMDA) data; CoreLogic.
Notes: This chart shows the key coefficients for a linear probability regression that relates loan acceptance rates (1= accepted by borrower and bank) to a host of loan, region, and borrower characteristics, as well as key variables that denote the share of properties in a census tract that are “inaccurately mapped” or “very inaccurately mapped.” It shows the Second District (excluding Puerto Rico and the U.S. Virgin Islands) and the rest of the nation separately and focuses only on the coefficients of interest for non-jumbo loans.
We find that bank loans in areas that have inaccurate maps have a somewhat lower acceptance rate, all else equal. Areas that have very inaccurate maps see a more pronounced reduction in acceptances. If we include borrower characteristics—especially borrower income and loan-to-value ratios—the relationship between the share of inaccurately mapped properties and loan acceptance rates becomes less negative among jumbo loans than in the raw correlation. This may be a reflection of the ability of these borrowers to make a larger down payment to help offset the bank’s perceived risk.
It is worth mentioning that while these reductions in the acceptance rates are statistically significant, they are small relative to the effects of applicant income or wealth. A Second District community in which 10 percent of all properties are inaccurately mapped may see a reduction of 3 percent in acceptance rates. A 10 percent drop in income would see a rejection response that is fourfold larger. Our results likely reflect some residual bank risk aversion—not all conforming loans are securitized, after all. Moreover, banks that are aware of the inaccurate mapping likely expect maps to change following future updates. Since lenders/servicers have to ensure that pre-existing borrowers who are newly mapped into flood zones buy insurance after a grace period expires, they may be ex ante unwilling to lend to these inaccurately mapped households. Alternatively, banks may be worried about the ability of the marginal borrower to make the required insurance payments.
The reaction of lenders to inaccurate maps in the Second District is comparable to that in the nation as a whole, especially among non-jumbo borrowers. The response to very inaccurate maps is somewhat stronger in southern states, which may reflect increased risk of catastrophic flooding. While we do not fully account for a wide range of region-specific factors that may differ between the Second District and the rest of the nation, we still find that bank responses to inaccuracies are broadly comparable—that is to say, they reduce lending. This suggests that bank reactions to inaccurate maps are not state-specific but are more likely to be a reflection of general risk aversion.
Concluding Remarks
We find that banks are somewhat responsive to inaccurately mapped areas. They are less willing to lend in regions with poor flood maps, even if these loans can be securitized. In this regard, the Second District is no different than the rest of the nation. While bank reactions to inaccurate maps are small, the presence of statistically meaningful lending differences implies that banks manage and are aware of flood risk, at least to some degree. The next post in this series exploits the newly updated maps to examine whether firms take flood risk into account when choosing their business locations.

Kristian Blickle is a financial research economist in Climate Risk Studies in the Federal Reserve Bank of New York’s Research and Statistics Group.
Katherine Engelman is a former data scientist in the Data and Analytics Office in the Bank’s Technology Group.

Theo Linnemann is a data scientist in the Data and Analytics Office in the Bank’s Technology Group.

João A.C. Santos is the director of Financial Intermediation Policy Research in the Federal Reserve Bank of New York’s Research and Statistics Group.
How to cite this post:
Kristian S. Blickle, Katherine Engelman, Theo Linnemann, and João A. C. Santos, “How Do Banks Lend in Inaccurate Flood Zones in the Fed’s Second District?,” Federal Reserve Bank of New York Liberty Street Economics, November 13, 2023, https://libertystreeteconomics.newyorkfed.org/2023/11/how-do-banks-lend-....
Potential Flood Map Inaccuracies in the Fed’s Second District

The Adverse Effect of “Mandatory” Flood Insurance on Access to Credit

Moving Out of a Flood Zone? That May Be Risky!
Disclaimer
The views expressed in this post are those of the author(s) and do not necessarily reflect the position of the Federal Reserve Bank of New York or the Federal Reserve System. Any errors or omissions are the responsibility of the author(s).
Stiglitz on credit creation by banks
For those who think that Joseph Stiglitz doesn't know that banks actually create credit:
"We are not in a corn economy where banks serve as an intermediary between farmers who have excess seed and farmers who want more seed. We are in an economy where banks actually create credit. And that makes a very big difference."
h/t: wonkmonk
Does the concentration of finance matter?
It may sound like a strange question in light of all the talk about "too big to fail" during the last few years. But, believe or not, the idea that bank concentration has an impact on real economic activity isn't the standard view. Here's from a recent blog post by NY Fed economists Mary Amiti and David Weinstein:
The notion that financial institutions are large relative to the size of economies is not something that plays a prominent role in traditional economic theory. Macroeconomic textbooks tend to treat economies as composed of representative firms that are infinitesimal in size compared to any given market. As a result, positive and negative idiosyncratic shocks [movement in bank loan supply net of borrower characteristics and general credit conditions] to financial institutions cancel out due to the law of large numbers.
However, this representation stands in stark contrast with the reality of concentration in financial markets. A striking regularity is that a few banks account for a substantial share of an economy’s loans.
Starting from this basis, Amiti and Weinstein have examined Japanese aggregate bank lending data and other aggregates and were able to demonstrate the following: banks matter, bank concentration matters, bank lending matters. No small feat.
On the issue of bank concentration and aggregate lending, they found that
...if markets are dominated by a few financial institutions, cuts in lending due to some change in financial conditions in just a small number of banks have the potential to substantially affect aggregate lending. Moreover, if firms find it hard to find good substitutes for loans like issuing equity or debt, then it is possible for their investment rates to fall as well.
As for their take on banks' impact on the real economy, the conclusion to their paper (on which their blog post in based) gives a good summary:
Our paper contributes to this literature by providing the first evidence that shocks to the supply of credit affect firm investment rates. We find that even after controlling for firm credit shocks, loan supply shocks are a significant determinant of firm-level investment of loan-dependent firms. This result is particularly surprising because our sample is comprised of listed companies that have, by definition, access to equity markets. Moreover, the fact that so much lending is intermediated through a few financial institutions means that idiosyncratic shocks hitting large financial institutions can move aggregate lending and investment. We show that about 40 percent of the movement in these variables can be attributed to these granular bank shocks. This means that the idiosyncratic fates of large financial institutions are an important determinant of investment and real economic activity.
And the implication for policy, according to Amiti and Weinstein, is significant. Here is the relevant excerpt of their blog post on this point:
...[P]olicymakers without detailed information on the major financial institutions are likely to have a difficult time understanding the causes of lending and investment fluctuations. A large portion of Japan’s aggregate economic fluctuations can be traced to the country’s banking problems.
While many researchers have focused on the implications of banks being “too big to fail,” we show that even if large banks do not fail, granular bank shocks can have substantial impacts on aggregate investment.
For example, reductions in bank capital at large financial institutions can cause investment declines by firms that would like to borrow, while recapitalization of the right institutions can stimulate investment. In sum, this study shows that what happens to large financial institutions is important for understanding aggregate investment behavior.
While their paper looks specifically at Japanese data, the authors suggest that the overall conclusions are relevant to the situation in the US given that it too has a very concentrated banking sector.
Amiti, Mary and David Weinstein, How much do banks shocks affect investment: Evidence from matched bank-firm loan data, NY Fed staff paper 604, March 2013