Internal Liquidity’s Value in a Financial Crisis

A classic question for U.S. financial firms is whether to organize themselves as entities that are affiliated with a bank-holding company (BHC). This affiliation brings benefits, such as access to liquidity from other affiliated entities, as well as costs, particularly a larger regulatory burden. This post highlights the results from a recent Staff Report that sheds light on this tradeoff. This work uses confidential data on the population of broker-dealers to study the benefits of being affiliated with a BHC, with a focus on the global financial crisis (GFC). The analysis reveals that affiliation with a BHC makes broker-dealers more resilient to the aggregate liquidity shocks that prevailed during the GFC. This results in these broker-dealers being more willing to hold riskier securities on their balance sheet relative to broker-dealers that are not affiliated with a BHC.
Data and Background
Broker-dealers represent an ideal setting to analyze the value to being affiliated with a BHC for two reasons. First, broker-dealers exist as both standalone firms and as part of BHCs, the necessary variation in organizational form. Second, broker-dealers tend to be highly levered and as such are sensitive to changes in market and funding liquidity. As such, an affiliation with a BHC, and thereby access to the liquidity that a BHC can provide, could be quite important to a broker-dealer, especially during times of stress.
Our analysis uses balance sheet and income statement data from the Financial and Operational Combined Uniform Single (FOCUS) report forms filed by all broker-dealers that are registered with the U.S. Securities and Exchange Commission (SEC). The Financial Industry Regulatory Authority (FINRA) provided access to these confidential reports filed by its member firms, the vast majority of broker-dealers. As such, the full cross section of broker-dealers is considered. The work focuses on the GFC, because it is precisely during such an aggregate liquidity shock that one expects an affiliation with a BHC to matter.
The chart below demonstrates that in terms of total assets, broker-dealers are roughly split across BHC affiliated and non-BHC affiliated from 2004 to 2011. Both types of broker-dealers suffered during the GFC, with a large decline in total assets after the bankruptcy of Lehman Brothers in September 2008.
BHC and Non-BHC Broker-Dealers Lost Assets after the Lehman Bankruptcy
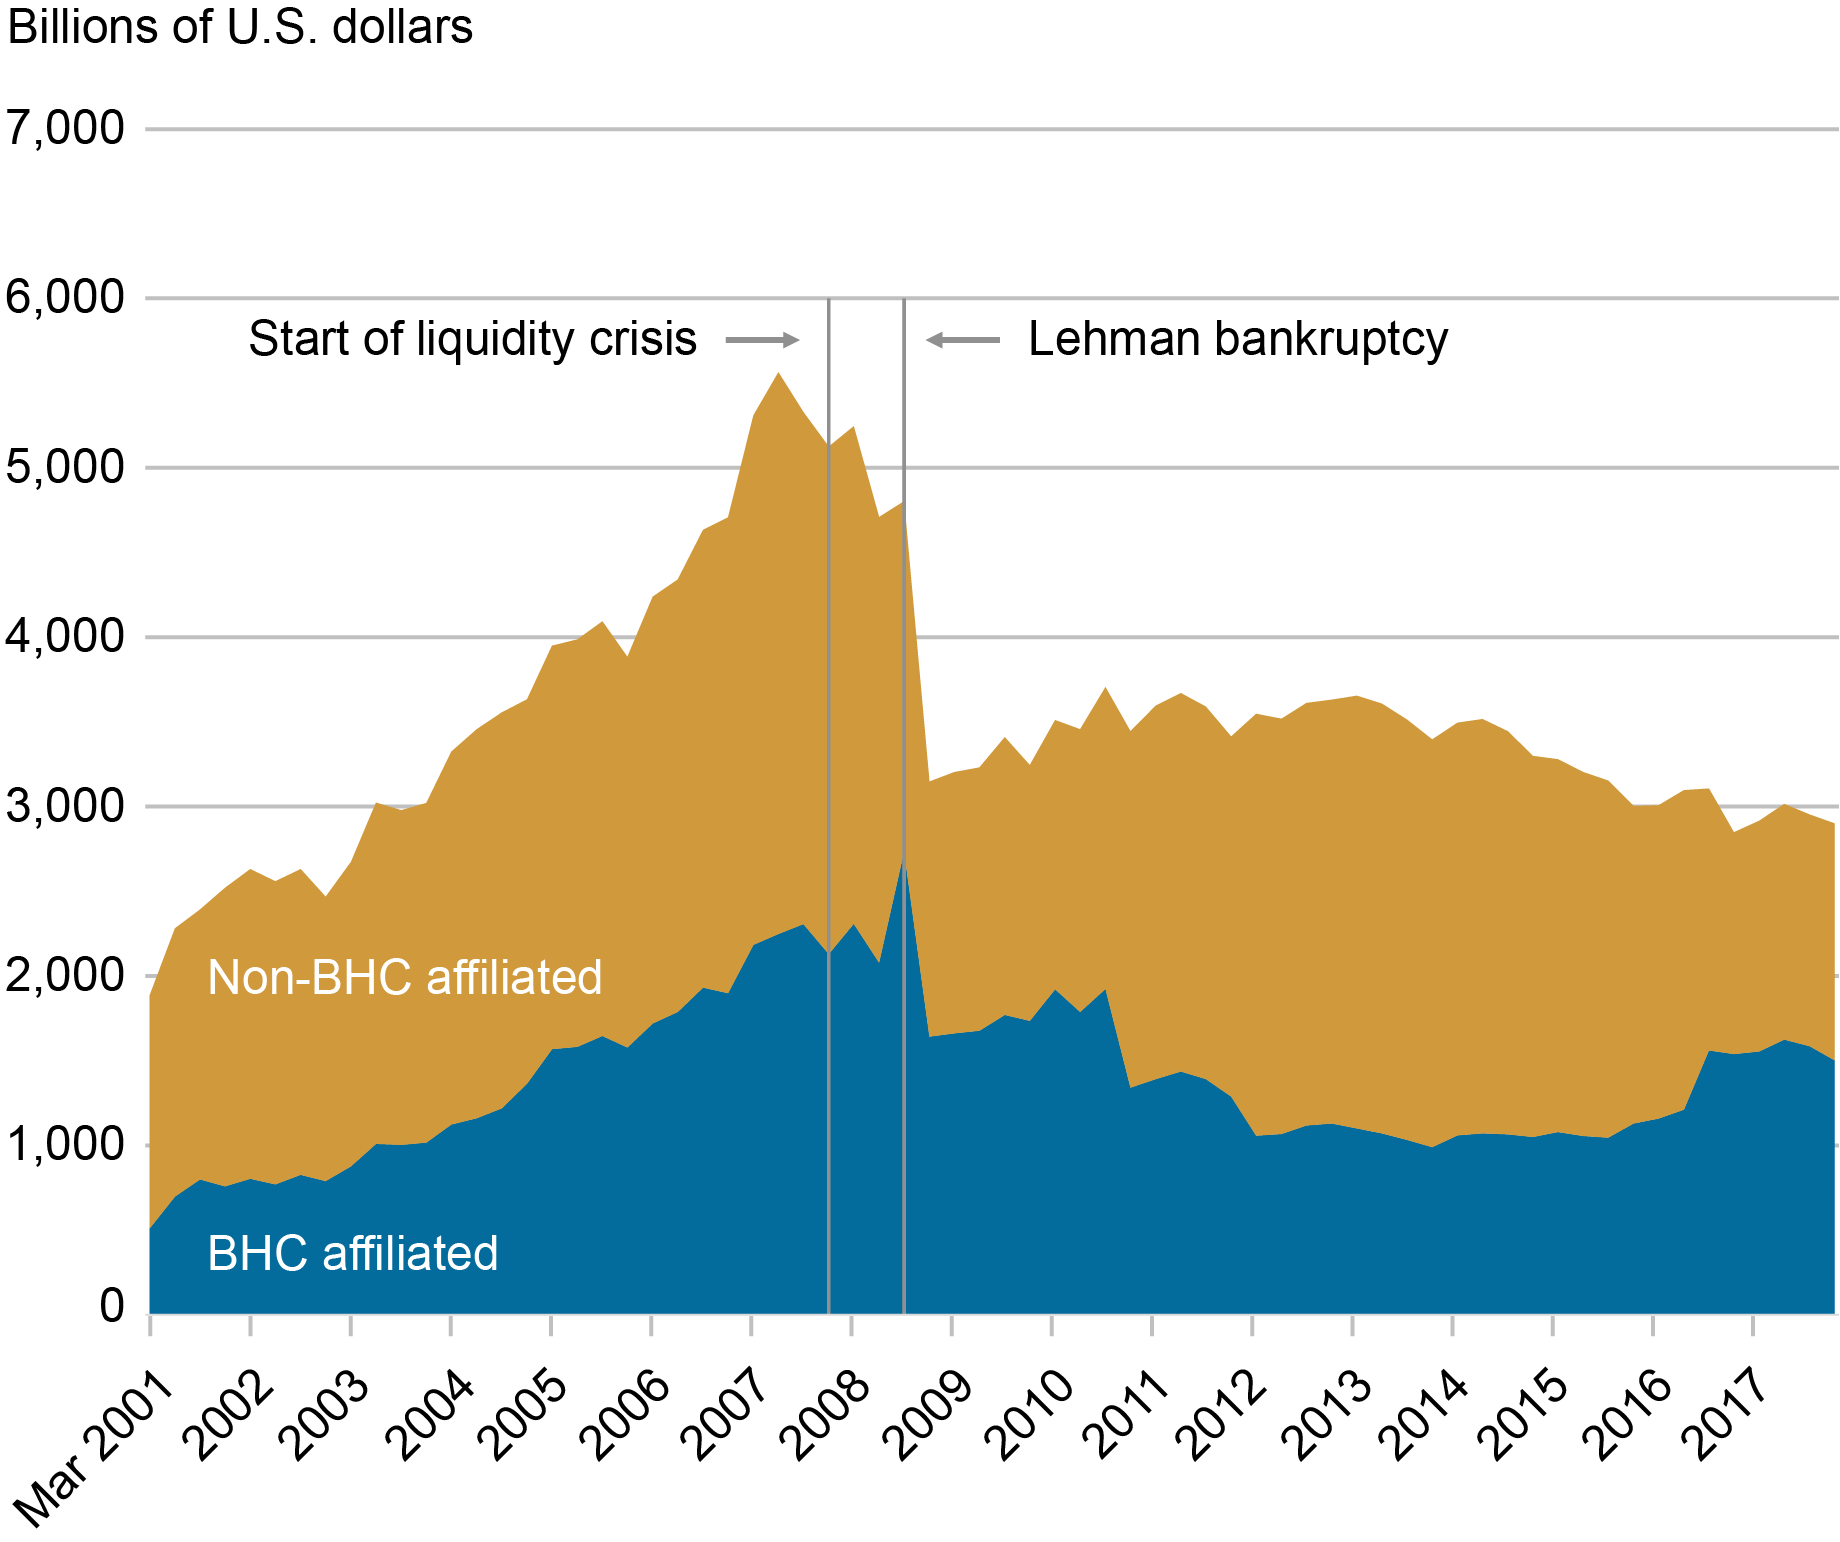 Source: FOCUS reports and author’s calculations.
Analysis
Our analysis of dealers’ balance sheets looks for evidence of broker-dealers shifting toward trading Treasuries to a larger degree over the GFC, given the safety and liquidity of these securities. Furthermore, the analysis considers whether there is a difference in behavior between BHC-affiliated and non-BHC affiliated broker-dealers. Changes in trading strategy around Treasuries will show up on balance sheets as changes in repo and reverse repo activity, as well as long inventory holdings. As a result, we focus on these three balance sheet items.
The table below details how these three balance sheet items, as a share of total assets, varied across the pre-crisis period (2004:Q1 to 2007:Q3) and during the crisis (2007:Q4 to 2011:Q4).
In the Crisis, Non-BHC Broker-Dealers Moved Toward Trading Treasuries Unlike BHC Broker-Dealers
Non-BHC BHCPre-crisisCrisis Pre-crisisCrisisRepo share of total assets40.7%43.4% 45.3%30.0%Reverse repo share of total assets31.9%37.9% 33.2%21.6%Government securities share of long inventory50.2%54.7% 45.6%42.5%Source: FOCUS reports and authors’ calculations.
Notes: BHC is the group of broker-dealers affiliated with a bank-holding company, non-BHC is the group of broker-dealers not affiliated with a bank-holding company. Further, pre-crisis is from the first quarter of 2004 to the third quarter of 2007 and crisis is from the fourth quarter of 2007 to the fourth quarter of 2011.
During the crisis, non-BHC affiliated broker-dealers increased their repo and reverse repo activities as a share of total assets. For these broker-dealers, repo activity’s share of total assets climbed from 40.7 to 43.4 percent. Similarly, reverse repo activity’s share increased from 31.9 to 37.9 percent. In contrast, BHC broker-dealers decreased their repo and reverse repo activity by substantial amounts.
These changes in repo and reverse shares are consistent with the story of non-BHC affiliated broker-dealers reacting to an aggregate liquidity shock with a flight to quality and so increasing their trading of Treasuries. Furthermore, BHC affiliated broker-dealers, given their access to internal capital markets, did not face the same liquidity pressures and decreased their share of trading Treasuries.
This story is further supported by considering government securities’ share of long inventory. Non-BHC affiliated broker-dealers increase this share by 4.5 percentage points, on average, whereas BHC affiliated broker-dealers decreased this share by 3.1 percentage points.
Formal regression analysis reinforces this message and demonstrates that the results outlined above are robust. A main result is that non-BHC affiliated broker-dealers shift toward the use of repos and reverse repos as a share of total assets by more than 10 percentage points relative to BHC affiliated broker-dealers. In addition, there is a dramatic difference in the composition of long inventory, where the estimated coefficients imply that non-BHC affiliated broker-dealers increased the share of Treasuries held in long inventory by 5 percentage points whereas BHC affiliated broker-dealers decreased that share by 10 percentage points.
Takeaway
Our main result provides evidence that broker-dealers that are not associated with BHCs dramatically re-structured their balance sheet during the GFC, pivoting away from illiquid assets and toward more liquid government securities. Dealers associated with BHCs did not need to undergo such extreme changes in part because they had access to internal liquidity. This allowed BHC-affiliated dealers to provide more intermediation services in a range of financial markets that were under stress, likely reducing the extent of the disruptions.
The benefits from having access to internal liquidity are likely informative about the benefits of access to liquidity from the Federal Reserve. In fact, the benefits of access to central bank liquidity are likely to be greater since that liquidity should be more reliable than access to internal liquidity. Among broker-dealers, the Federal Reserve’s Standing Repo Facility (SRF) is only available to primary dealers. The results of this work suggest that there could be benefits to wider access to broker-dealers, especially those not affiliated with BHCs, in line with the recommendation of the Group of Thirty report.

Adam Copeland is a financial research advisor in Money and Payments Studies in the Federal Reserve Bank of New York’s Research and Statistics Group.
Cecilia Caglio is the chief of the financial structure section at the Federal Reserve Board.
How to cite this post:
Cecilia Caglio and Adam Copeland, “Internal Liquidity’s Value in a Financial Crisis,” Federal Reserve Bank of New York Liberty Street Economics, April 8, 2024, https://libertystreeteconomics.newyorkfed.org/2024/04/internal-liquidity....

The Value of Internal Sources of Funding Liquidity: U.S. Broker-Dealers and the Financial Crisis

The Fed’s Latest Tool: A Standing Repo Facility
Disclaimer
The views expressed in this post are those of the author(s) and do not necessarily reflect the position of the Federal Reserve Bank of New York or the Federal Reserve System. Any errors or omissions are the responsibility of the author(s).