How Many People Are Applying for Philosophy Jobs? (guest post)
How many people went on the philosophy job market this past cycle?
Once again, Charles Lassiter (Gonzaga University), has spent a fair amount of time gathering and analyzing data about the philosophy profession. This time, he has focused on the numbers of people applying for philosophy jobs.
(A version of this post first appeared at Professor Lassiter’s blog.)

[Charles Atlas, “Painting By Numbers” (video still)]
How Many People Are Applying for Philosophy Jobs?
by Charles Lassiter
Over the course of last semester, I sent out requests to heads of search committees to fill out a brief survey to figure out how many people were on the job market this past cycle.
First, a HUGE thanks to Gonzaga undergrad Kate Ferrell and Gonzaga philosophy grad student Tobias Propst for collecting the names and email addresses. Without them, this would have taken a lot longer.
I sent out 239 emails and gathered 79 completed responses. Thank you to everyone who filled it out! Here’s the breakdown of responses by Carnegie classification:
Certificate: 1
Bachelors: 25
Masters : 6
Doctorate : 43
I didn’t collect identifying information about the institutions or programs. I asked for number of applicants, AOS, Carnegie classification (R1, R2, MA, BA, certificate), teaching requirements, and some subjective impressions about volume of applications proportion of teaching and research.
(Quick note about terminology: from here on, I use “status” as shorthand for the category of highest degree awarded. It seems like a neutral-ish and short term for the category.)
Ok, so let’s get to it. The big picture: the average for numbers of applicants across all responses is 136. Given the responses and the number of invitations sent out, the margin of error is +/- 9% (with 95% confidence level). So the average for number of people on the market is probably somewhere between 125 and 147. That being said, there is a lot of variation.
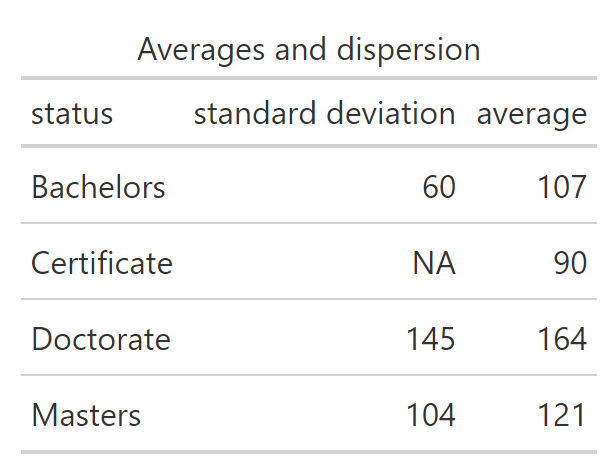
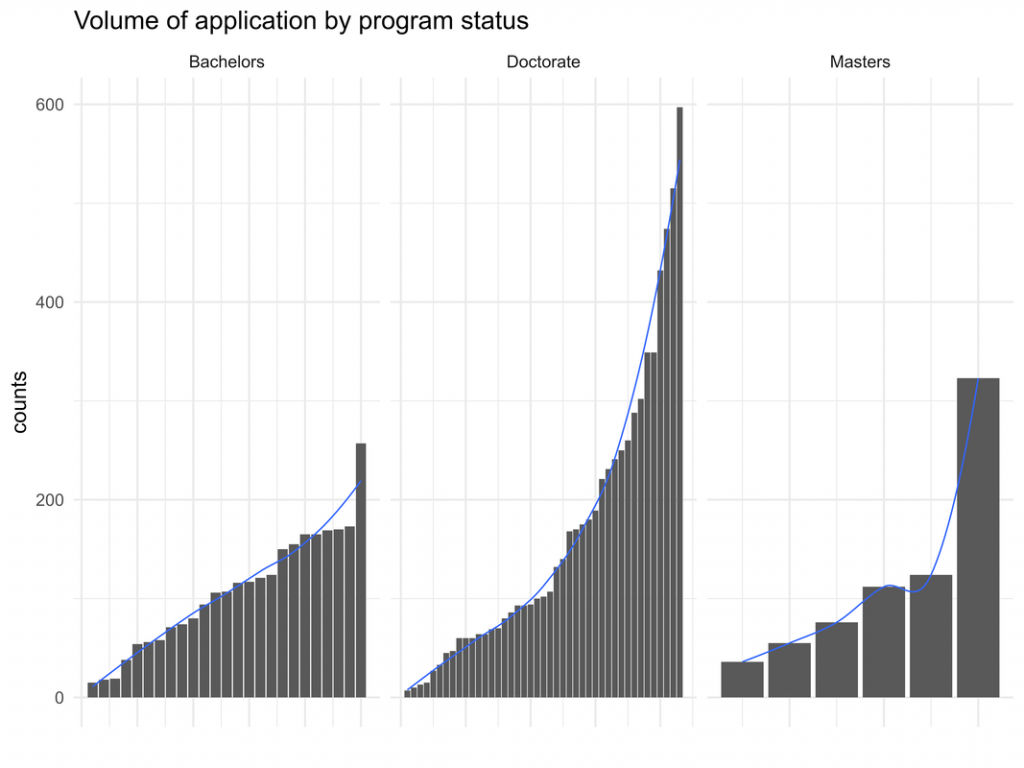
The number of applicants to jobs at doctoral institutions was higher on average than any other, but there was a lot more spread around that average. This is clear from the table, but also look at the following plots. Differences among numbers of applicants to BA-granting institutions are roughly linear. But for PhD-granting institutions, it’s closer to exponential. (There were relatively few MA-granting institution responses, so I’m hesitant to draw conclusions.)
Now let’s pull together a bunch of info about applications to various programs: the fewest, average, median, and greatest number of applicants by program status.
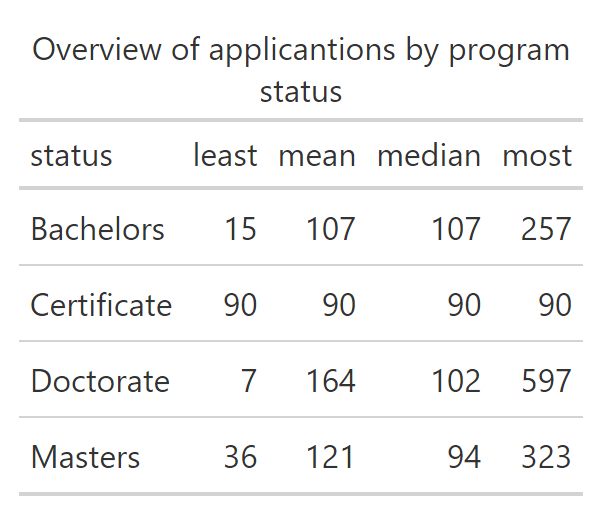
It looks like jobs with PhD programs are getting a lot more applications than any other. In fact, the values for max and average applications decreases as the status of the program goes from PhD to MA to BA. (It’s hard to draw conclusions about jobs at certificate-granting institutions since there was only one response.) A first hypothesis: Applicants preferentially apply for jobs at PhD-granting institutions. Two things to check: (i) whether the trend holds for R1 and R2 and (ii) if the values are a result of open-rank hires.
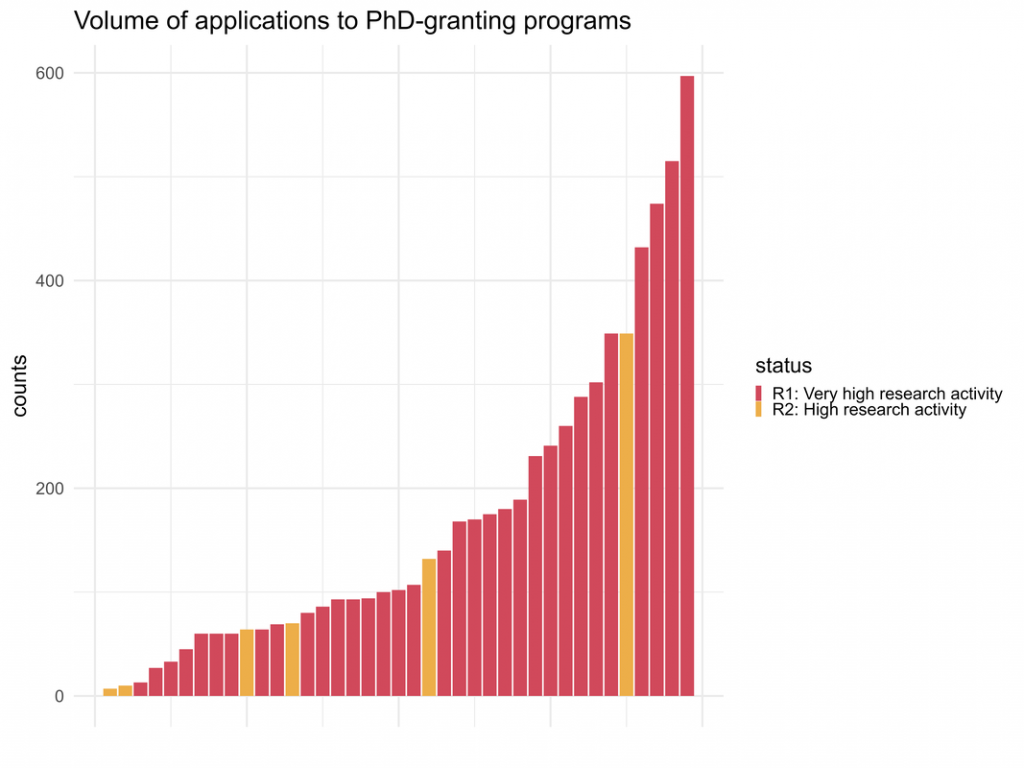
For (i), the trend doesn’t hold for differences between R1 and R2 jobs among respondents, but it’s worth noting that there were relatively few R2 respondents.
For (ii), let’s restrict the data to TT jobs only. That way, our numbers aren’t inflated by open-rank hires.
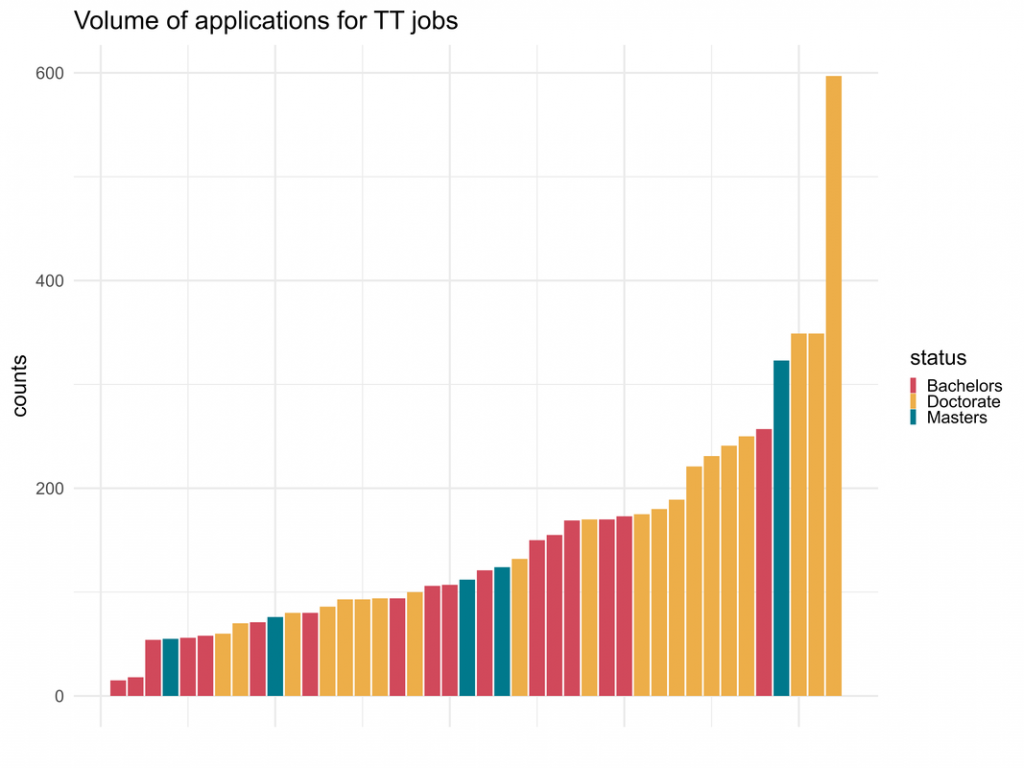
I think our initial hypothesis is right: applicants are biased towards applying for jobs at PhD-granting programs but the data don’t suggest that this bias holds for R1 vs R2 programs.
Let’s look at the numbers breaking out by AOS and program status. An important caveat: our 9% margin of error was for all responses to all surveys sent out. Once we begin dividing up the pool of responses, the margin of error increases and sometimes substantially. Suppose that the split between jobs advertised for BA- and PhD-granting institutions was 50/50. The MoE for the BA-granting average jumps to 17% and for the PhD-granting average to 12%. So once we begin parsing into subgroups, I’m saying less about all jobs for this year and more about the responses. I’ll try to be explicit about that where appropriate.
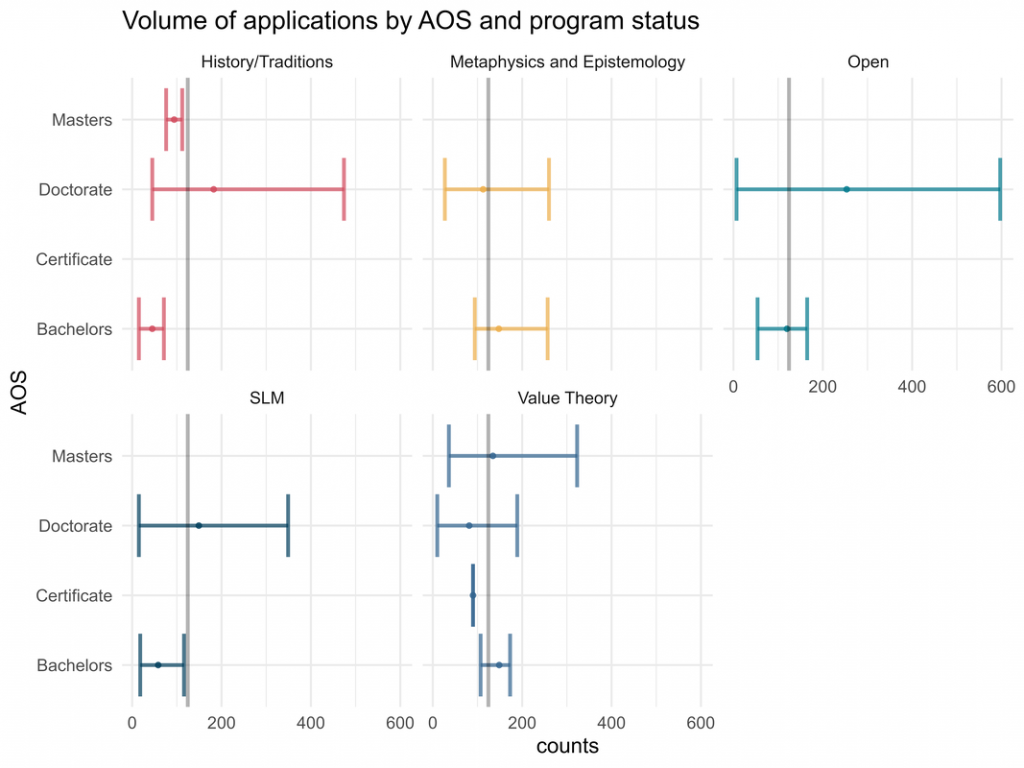
Here’s how to interpret the plot. The vertical grey line is the average for each AOS. The error bars give the minimum and maximum values for each status and AOS. The point in the error bar is the average for AOS and status. The tables for these values are here.
This plot pulls together a lot of what we’ve previously mentioned. Jobs at PhD-granting institutions tend to get more applications than elsewhere, particularly for open and history/tradition AOS. The jobs that on average had the fewest applications among respondents were history/tradition jobs at BA-granting institutions. In fact, in 2 out of 5 cases, the max number of applications for BA programs is less than the average for that AOS.
My interpretation of PhD-programs having more applicants is a manifestation of two sides of prestige bias. On one side, it’s plausible that many candidates want to apply almost exclusively to prestigious jobs, where being a PhD-granting program tracks prestige. The other side of the coin is that candidates sell themselves short, thinking that there’s no way they could make it past the first round at an R1 or R2.
That being said, if there are other plausible interpretations, please feel free to share!
One of the takeaways restricted to the respondents (but is perhaps indicative of the wider field of applicants and openings) is that if you’re applying to R1’s, you’ll likely find yourself with a lot more competition relative to MA- and BA-granting programs, particularly for open, science/language/math, and history/tradition AOS’s.
Two more tables before calling it a day: one about impressions of applicant volume and another about time allotment for the job.
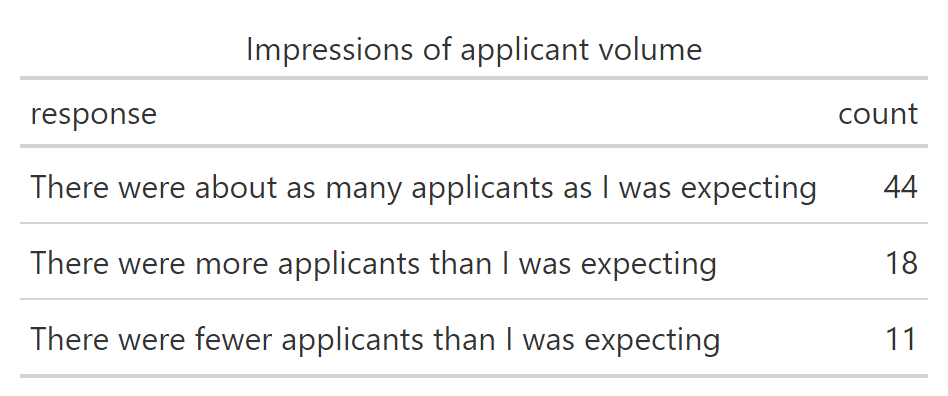
So that’s good to know: typically, committee chairs have decent expectations for the numbers of applicants. How does this compare to the numbers of applications received?
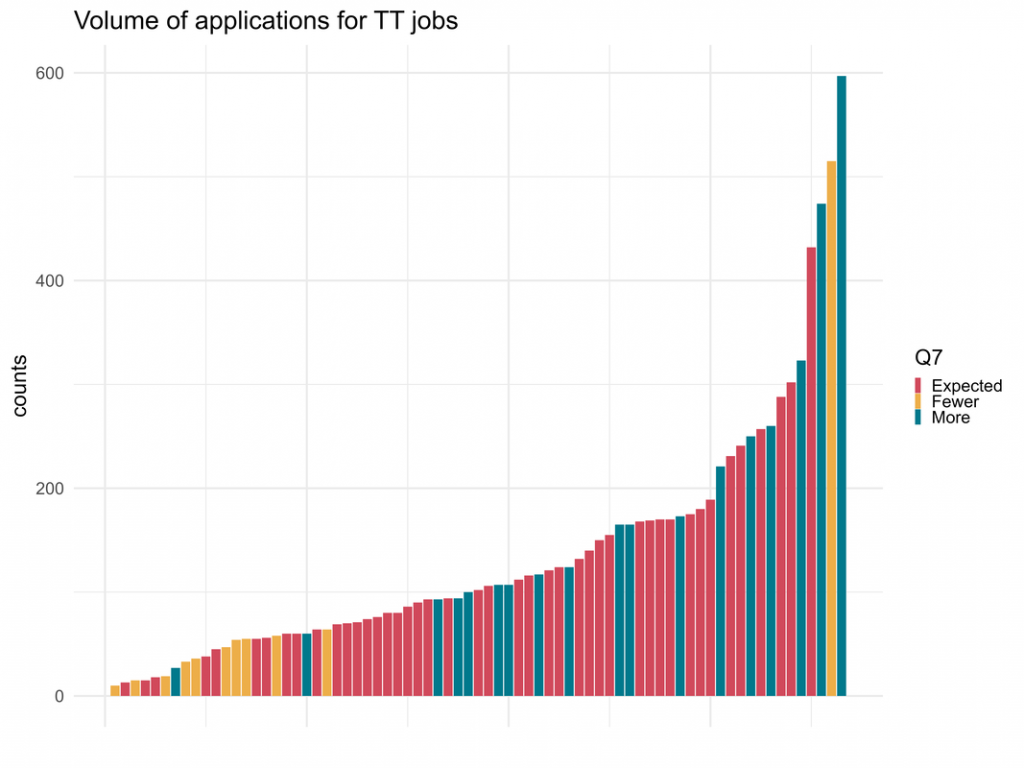
The “fewer” bar all the way to the right? That’s 515 applications for an open AOS, open rank position at an R1. With those parameters, I’d have guessed there would be more too.
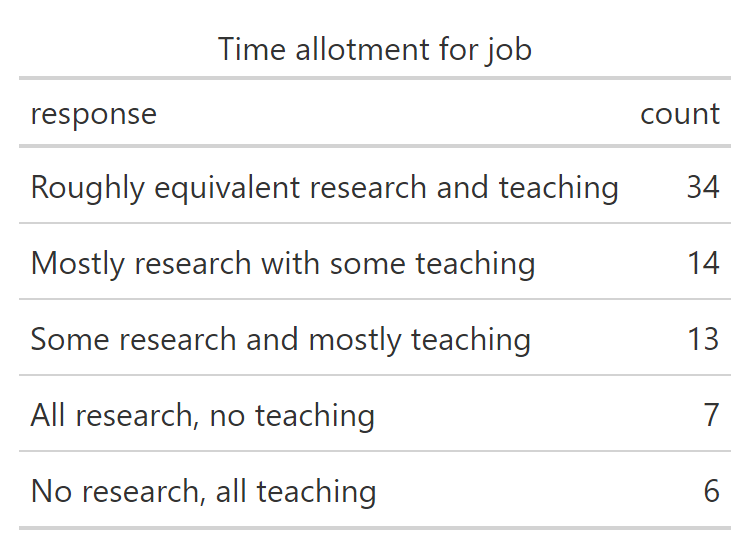
That’s useful to know: the typical response is that time spent teaching and researching is roughly equivalent. The breakdown for that number is:
BA-granting institutions: 8
MA-granting institutions: 4
PhD-granting institutions: 22
…which I found pretty darned interesting. As you might imagine, “mostly research with some teaching,” was largely PhD-granting institutions (12) and “some research and mostly teaching” was largely BA-granting institutions (10). The lesson, I think, is that job applicants can’t afford to neglect teaching or research in their applications but have to discern which to amplify for the job applied to. I think that’s common sense, but it’s nice to have some info to support it.
If you’d like the raw data and script, you can find them under the “blog data” tab.
Well, that’s all. If there are any other analyses you’d like to see, please let me know!
The post How Many People Are Applying for Philosophy Jobs? (guest post) first appeared on Daily Nous.